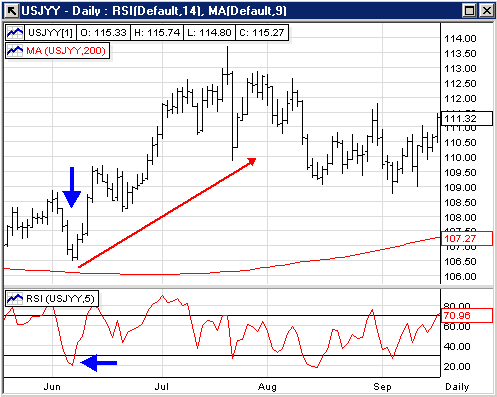
Low RSI above 200-day MA and price takes out previous high
The same opportunistic trading signals apply across all markets, whether
they are equities, currencies, futures, or commodities. Any market that
can be charted will display similar patterns and thus can be traded in the same
way. In this article, I will show you how to find uptrending currency
pairs that are pulling back. Even though there’s no assurances of future
performance, historically, this strategy has proven to find excellent candidates
to consider for trading and investing.
First off, we identify the trend using the 200-day simple
moving average.
We are going to consider the case of price being above the 200-day simple moving
average as an uptrend. Next we will look for a low 5-period Relative
Strength Index rating of 30 or lower. This tells us that the particular
currency pair is showing weakness, while moving in an uptrend. This
provides us with strong indication that the trend may resume.
Most importantly we will be adding the condition that the
current price must be above the previous day’s high. This helps to
indicate renewed buying and that the trend may continue. Let’s look at
a few examples:

The AD/USD chart above fulfills all the parameters set in this
strategy.
Notice the areas circled in blue. The price is above the red 200-day
moving average line and the 5-Period RSI reading is below 30 at that level. Also, as
the 5 Period RSI begins to rise the price also rises above the previous day’s close.
Below are 2 more examples of this setup.


Please note that it is not an automatic buy signal when all
the parameters are met. There are many external factors that may influence price. This strategy should be considered along with your own trading
style and goals.
Feel free to send me any questions or comments on this
strategy.
Best regards,
Darren Wong
Associate Editor
