Magnet
The
direction was down right out
of the gate on Friday morning for the major indexes, and straight to the magnet
swingpoint lows I mentioned in Thursday’s
text. These are always easy targets for the program gang when you have a
fragile market such as now, which gets whipped around from news to news, as the
Generals just probe at various levels.Â
The Nasdaq 100
(
NDX |
Quote |
Chart |
News |
PowerRating)
magnet low of 1580.57 was taken out, and then reversed up on the same 10:20 a.m.
bar. That proved to be the intraday low of the day as the NDX rallied to 1632,
closing at 1617.45. The choke factor is large at these magnet levels and the
professionals know this, so it is easy to dominate. Few traders play the
reversal of these lows but they should, with a stop and reverse short second
entry below the magnet low if the rally fails. You are entering a trade with a
high reward to risk, because you have a shot in either direction with a tight
stop.
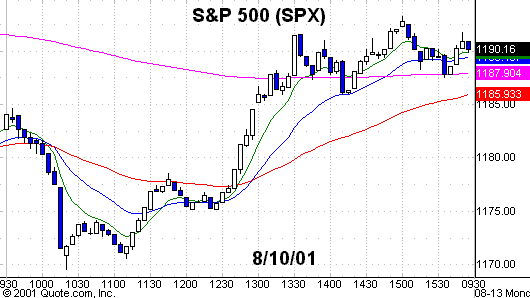
The S&P 500
(
SPX |
Quote |
Chart |
News |
PowerRating)
challenged its magnet low of 1165.57, but held at 1169.55 and rallied to 1193,
closing at 1190.16. Both the NDX and SPX gave you 1,2,3 entries off these lows
as the trend was up for the rest of the day. The NYSE volume was only 85% of its
average volume at 959 million, a volume ratio of 61 and breadth positive at
+743.
The SPX closed +0.6% and
the Dow +1.1%. The NDX still finished negative at -0.7% and the retail Nasdaq
-0.3%. The Nasdaq traded 1.365 billion or just 75% of its average volume, a
volume ratio of only 35 and breadth slightly negative, -201. The tech wreck
continues while the cyclicals picked up the Dow and SPX.
The semis showed a little
green as you got some reflex bounces off some of the levels I mentioned last
week. The best of the lot was
(
KLAC |
Quote |
Chart |
News |
PowerRating) which visited its 200-day zone on
Thursday and followed through to the upside on Friday on above-average volume.
The only other semi which gave us any increase in volume was
(
TXN |
Quote |
Chart |
News |
PowerRating) which
closed at 34.65, +1.3%.
Semis like
(
INTC |
Quote |
Chart |
News |
PowerRating)
(which was +1.05% on 76% of its average volume),
(
MU |
Quote |
Chart |
News |
PowerRating) (+1.3% on 78% of its
average volume), and
(
NVLS |
Quote |
Chart |
News |
PowerRating) (+1.8% but on only 62% of its average volume)
were reflexes up, but not on much money from the Generals. The SMHs closed at
46.19 after bouncing off the .618 zone and hitting 44.38 on Friday. You were
ready for that one, I hope.
What we did end up with on
Friday is a lot of top-of-the-range closes, which puts us on alert for
continuation long entries above Friday’s highs, should the Generals show up
today and throw some money at the semis. After
the recent string of down days, the bias is probably up into option expiration
this Friday.
|
(September
|
||
|
Fair Value
|
Buy
|
Sell
|
|
3.25
|
 4.35  |
|
Stocks
Today
In the semis:
(
KLAC |
Quote |
Chart |
News |
PowerRating),
(
TXN |
Quote |
Chart |
News |
PowerRating),
(
MXIM |
Quote |
Chart |
News |
PowerRating),
(
BRCM |
Quote |
Chart |
News |
PowerRating),
(
GNSS |
Quote |
Chart |
News |
PowerRating) and
(
ISIL |
Quote |
Chart |
News |
PowerRating).
Also, a few other semis to
keep on your radar screen:
(
IDTI |
Quote |
Chart |
News |
PowerRating),
(
NVLS |
Quote |
Chart |
News |
PowerRating),
(
ELNT |
Quote |
Chart |
News |
PowerRating) and
(
NVDA |
Quote |
Chart |
News |
PowerRating).
In the cyclical area, if
they show up again today, look at
(
MMM |
Quote |
Chart |
News |
PowerRating),
(
DOW |
Quote |
Chart |
News |
PowerRating),
(
GP |
Quote |
Chart |
News |
PowerRating),
(
IP |
Quote |
Chart |
News |
PowerRating) and
(
TYC |
Quote |
Chart |
News |
PowerRating).
A few other stocks also on
the long side are
(
LEH |
Quote |
Chart |
News |
PowerRating),
(
BSC |
Quote |
Chart |
News |
PowerRating) and
(
JNJ |
Quote |
Chart |
News |
PowerRating).
On the short side today,
because it’s option expiration week, I’d stay with the market proxies, the Qs,
DIAs or SPYs.
Have a good trading day.

Five-minute chart of
Friday’s S&P 500 with 8-, 20-,
60- and 260-period
EMAs

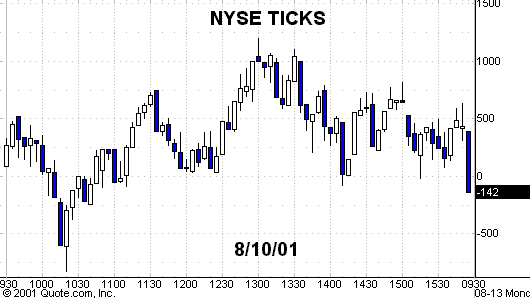
Five-minute chart of
Friday’s NYSE TICKS
Do you have a follow-up question about something in this column or other questions about trading stocks, futures, options or funds? Let our expert contributors provide answers in the TradingMarkets Trading Advisor! E-mail your question to questions@tradingmarkets.com.
For the latest answers to subscriber questions, check out the Q&A section, linked at the bottom-right section of the TradingMarkets.com home page.
