Market bottom or just the beginning?
Friday’s session was a major selling
event fed by all of the catalysts we’ve heard = read about all weekend.
Regardless, does that leave pending price action at the bottom of our next major
dip to buy? Is there further downside to come? Have we possibly seen the highs
for awhile, maybe even quite some time to come?
ES (+$50 per index point)
S&P 500 futures were weak off the open on
Friday and cascaded lower with no serious attempts to halt the slide. Several
lifts into resistance offered highly profitable short trade signals inside three
primary swings downward. ES 1274 is the first major point of resistance above,
where if hit would mark a high-odds swing trade point of entry to short.
Possible lows to 1220 area below are probable if selling resumes early this
week.

NQ (+$20 per index point)
Nasdaq 100 futures were perfectly methodical
all session on Friday. Sell signals at each blue arrow added for clarity gave
every NQ trade multiple opportunities to profit. This descent has the 1600 area
as next targeted magnet of attraction should selling continue.
NQ 1710 is the upper target of initial strong
resistance today.

ER (+$100 per index point)
Small caps held up relatively higher than all
other index markets. A spurt of buying into the close showed where dip buyers
remained active even while big caps went out on their lows. Any upside potential
from here should have ER leading the way, while further selling probably
accelerates this symbol to the downside as it plays “catch up” to others.

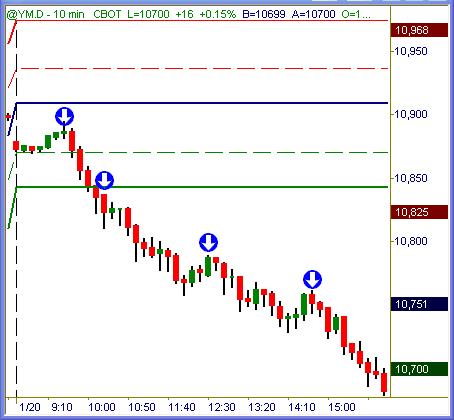
YM (+$5 per index point)
Dow futures also offered several clear sell
signals (blue arrows added) that all worked for sizable gains thru three swings
downward. Biggest day lower since March 2003, although we can expect to see more
200-pt range sessions in 2006 to come.
Summation
In the big picture, price action has merely pulled back to higher levels of
trend chart support. The fact that this happened in a somewhat dramatic, one-day
event rather than gentle selling on lighter volume. A number of weak-hand longs
shook themselves out on Friday, and will want to probe the long side again with
any signs of strength. That said, this group along with longs still holding on
but worried will sell much quicker next time around should weakness show.
Market bottoms short-term or longer usually
happen in washout drops on high volume that bounce strongly soon after. We
should see whether this was just a normal pull back to support or something
early in a sustained downside correction in the next few sessions ahead. As
always, react to what you see in the charts versus temptations to predict. The
only market bias that counts is what your chart signals confirm… not what the
logical mind may assume.
Trade To Win
Austin P
(Online video clip
tutorials…
open access)
Austin Passamonte is a full-time
professional trader who specializes in E-mini stock index futures, equity
options and commodity markets.
Mr. Passamonte’s trading approach uses proprietary chart patterns found on an
intraday basis. Austin trades privately in the Finger Lakes region of New York.