Market Fails at Resistance
From 1990 to 1997, Kevin Haggerty served as Senior Vice President for Equity Trading at Fidelity Capital Markets, Boston, a division of Fidelity Investments. He was responsible for all U.S. institutional Listed, OTC and Option trading in addition to all major Exchange Floor Executions. For a free trial to Kevin’s Daily Trading Report, please click here.
Commentary for 9/6/11
In the previous commentary [Recession Denial and Market Reality] I stated that the odds still strongly favor the 1101.54 low and .382RT to 667 from 1576 getting taken out, especially when denial becomes reality about the recession that we are already in. Friday`s Jobs report was a big step in that direction. As I complete this commentary Sunday evening, the S&P futures are down -2.5% and the DOW futures -2.4%, so it is market reality time.
The BLS reported that the economy did not generate any new jobs during the month of August, which is the first time since 1945 as per the trivia bean counters. In order to get the number up to zero the BLS birth/net adjustment was +87,000, which is how many new jobs it estimated were created by new businesses that were started in August [please!].
Also, there were more than 2.5 million people not counted as unemployed because they had not looked for jobs in the previous 4 weeks. That is another little gimmick added this year by the BLS to make the horrendous job numbers look better. If the Govt doesn`t like the rules they change them to keep the Ponzi scheme going.
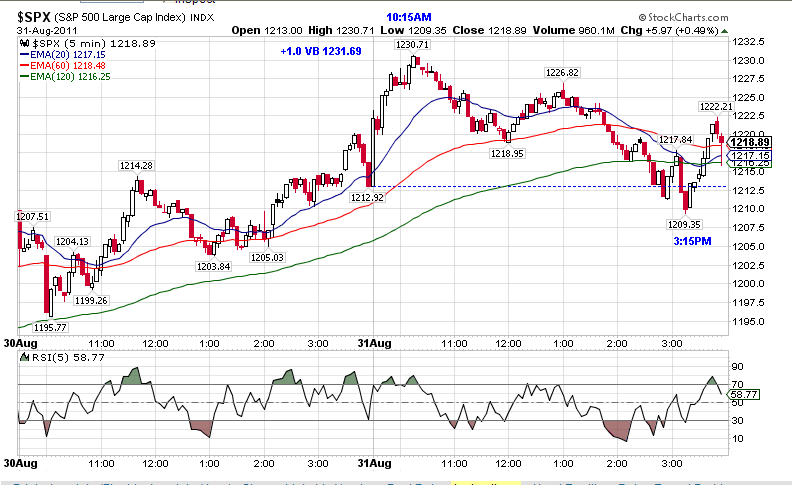
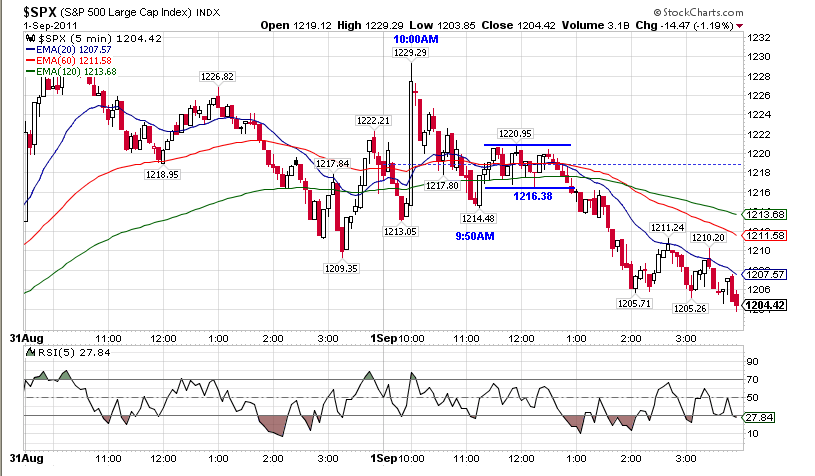
The SPX was +5.0% in 4 straight up days into month end and then declined -3.7% Thur and Fri to finish the week -0.2%. It failed twice last week at the 1228.75 .618RT to 1576 from 667 with intraday highs of 1230.71 on Wed and 1229.29 on Thur before closing the week at 1173.97.
The initial resistance outlined in the 8/16/11 commentary was the 1220 4/26/10 high and the 1227 11/5/10 high, in addition to that 1228.75 .618RT symmetry. The SPX hit 1220.10 last Tue [8/30] and declined to 1195.77 before closing at 1212.92. All 3 days last week were excellent daytrading opportunities from anticipated resistance in the SPX, and I have included the two SPX 5 min charts at the 1228.75 resistance zone.
Headline risk in the Euro zone accelerates in Sept on top of the dismal jobs outlook in the US, so the market is obviously extremely vulnerable to new lows.


Click here to find full details on Kevin’s courses including Trading with the Generals with over 20 hours of professional market strategies. And for a free trial to Kevin’s daily trading service, click here.
