Market Forecasting Tutorial Part 2 : Trend Analysis
In the first part of this series on market forecasting, Mike Stathis discussed his tips for predicting market direction and timing for better investments. You can read part 1 of “Market Forecasting Tutorial: Gauging Sentiment” by clicking here.
As you recall, the Dow made an all-time high in October 2007. Since then, it has made lower lows and lower highs, typical of a downward trend. But how far and how long will this bear market last?
First of all, we need to remember that the previous bullish rally was quite fast, with the lion’s share occurring over 6 months (May to October 2007) for around 18% gains. What does that mean? Well, in my opinion, it means the bullish rally was not that valid. Remember, price validity strengthens with time.
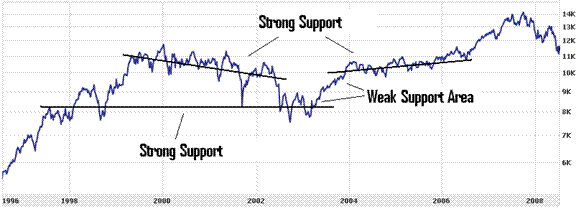
If we look where the Dow is now, it’s easy to see that it hit some strong support around the 10,800 range. However, this support was just prior to the previous Bull Run which began in early 2007. In other words, if in fact, the previous Bull Run was somewhat of an artifact, it is likely that the Dow has a way to go down before any long-term trend reversal.
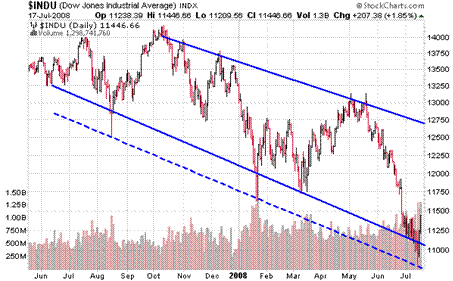
Next we examine a 14-month chart of the Dow. As you can see, I’ve drawn the upper and lower trend lines. The dashed lower trend line illustrates very short-term extreme selling pressure (intraday) I typically dismiss as noise. But as you can see, we’ve encountered three of these periods thus far (the large intraday sell-offs that rebounded strong at the close) making what I would normally consider to be noise an important consideration.
The question everyone is asking is, where will the market head over the next several months? No one knows for certain, as this depends upon many variables and the timing of these variables. All we can do is look at the possibilities. The first thing I will say is that, based upon the three previous periods of extreme selling pressure (intraday), it is likely that we will see additional periods of these brisk sell-offs, but only if the longer-term downward trend remains in place, which appears likely. These short, intense sell-offs, although intraday, strengthen the magnitude of the downward trend.
The Dow is currently trying to mount a strong rally up from the previous oversold level of around 10,800. Notice the high volume coming in to support the bottom trend line during the most recent market activity. This rally was triggered by the Fed’s bailout commitment to Fannie
(
FNM |
Quote |
Chart |
News |
PowerRating) and Freddie
(
FRE |
Quote |
Chart |
News |
PowerRating), as well as what has been interpreted as additional positive news in the financial sector. Thus, the market is once again looking for excuses to rally and is interpreting what I would view as bad news to be good news.
If this sentiment continues, barring any further catastrophic events over the next several weeks, it looks as if the market could continue the current rally. But by how much and for how long? Once again, it is impossible to say without knowing in advance several variables.
Assuming nothing major happens, it is entirely possible this rally could extend up to the 12,300 to 12,500 range over the next few months, perhaps sooner. As you can see from the upper trend line, the longer this rally stalls, the less it will ascend. As an example, if the market mounted a spectacular rally over the next two days, it might rise as high as the 12,700 level before meeting resistance.

Even if the current rally continues, that does not mean we won’t retest recent lows before making it all the way up. In contrast, if over the next few weeks, the market drops below recent lows, it could signal some really big problems since there is very little support until the 10,100 range. As the next chart shows, a breakdown below 10,000 would be catastrophic, as there is very little support down to the 8300 range. The good news is that the 10,600-10,800 support level is fairly strong and the 8300 level is stronger. The bad news is that, in my opinion, many more problems will surface down the road, not only with the financials, but with corporations, hedge funds, and consumers. It is likely we will see over 200 bank failures, a huge corporate junk bond market (to match that seen in the MBS market), and maybe even a meltdown of the derivative market, specifically the credit default swaps.

Understand that even if the market continues to rally from here, it is still in a longer-term downward trend with no real bottom in sight. Therefore, without significant evidence of a longer-term trend reversal (i.e. one or more strong rallies above the upper resistance trend line that hold above these levels over an extended period), investors would be wise to trim positions once the rally tops out (which could be in the 12,300-12,500 range) and wait for a sell-off to lower lows. As the angle between the upper and lower trend lines widens, you should expect to see even more market volatility down the road, most of it on the declining side.
Mike Stathis is the Managing Principal of Apex Venture Advisors, a business and investment intelligence firm serving the needs of venture firms, corporations and hedge funds on a variety of projects, including valuation analysis, deal structuring, investment strategy, market forecasting, and business strategy. Mike is the author of several publications including “America’s Financial Apocalypse: How to Profit from the Next Great”
