Market Has Symmetry Despite Volatility
From 1990 to 1997, Kevin Haggerty served as Senior Vice President for Equity Trading at Fidelity Capital Markets, Boston, a division of Fidelity Investments. He was responsible for all U.S. institutional Listed, OTC and Option trading in addition to all major Exchange Floor Executions. For a free trial to Kevin’s Daily Trading Report, please click here.
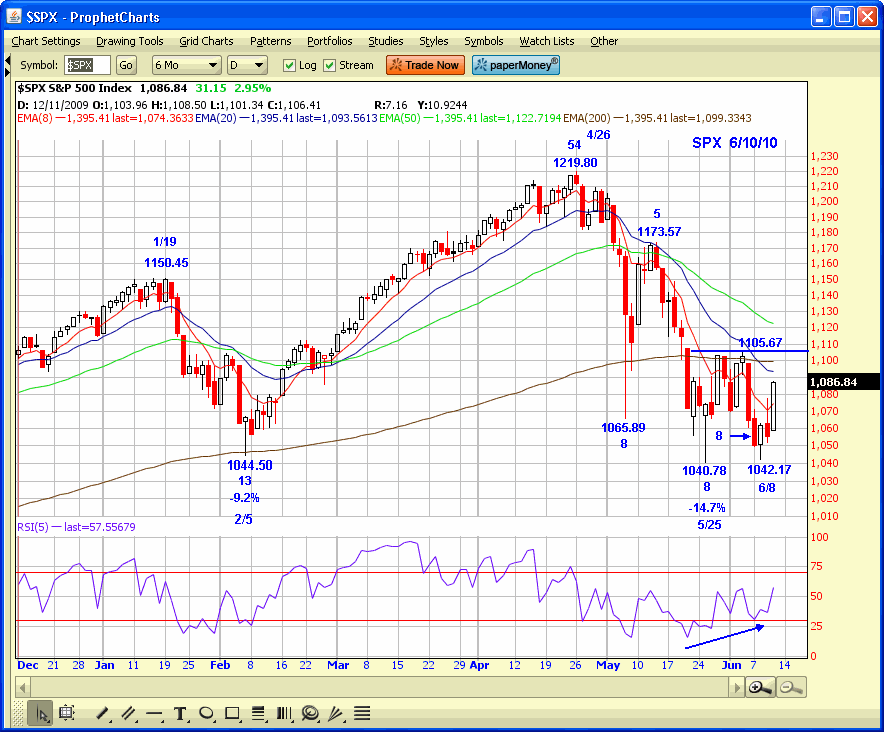
Going into yesterday the SPX had declined four straight days from the 1105.67 high last Thursday to the 1055.69 close on Wednesday. It was a -5.7% decline high to low from 1105.67 to the 1042.17 low on Tuesday, and the primary catalyst was the Euro making consecutive new lows as Gold and Treasuries advanced. Commodities have declined significantly with the Euro weakness as the global economic recovery outlook has lost its luster.
The SPX bounced +2.8% yesterday to close at 1086.84 while the INDU, QQQ, and COMPX had similar gains. NYSE volume was the lowest this week at 1.3 bill shs, but it was all one-sided with the Volume Ratio 95, Breadth Ratio 87, and breadth +2325. The commodity sectors were the most O/S and they were the leaders yesterday, with the OIH +6.9, XLE +5.0, XME +4.6, and XLB +3.6. There were significant declines for various sectors over the 4 straight down days such as the SMH -11.1%, XBD -9.1%, and BKX -7.6%, while the COMPX was -8.3% for that period, and the QQQ -6.2%.
It was a -14.7% decline for the SPX in 21 days from the 4/26 1219.80 high to the 1040.78 low, and as you can see on the chart, it has been trading to a Fibonacci day count symmetry with 8 days down to 1065.89, 5 days up to 1173.57, 8 days down to the 1040.78 low. The 1042.17 low held the previous 1040.78 low [so far] and that was 8 days to the low close and 9 days to 1042.17.
Despite all of the volatility due to the Euro sovereign debt mess the SPX has continued to trade with almost exact Fib symmetry. In fact, there were 13 days down from the 1/19 1150.45 high to the 10044.50 2/5 low, and this was followed by a 54 day advance [Fib 55] to the 1219.80 high on 4/26. It is also significant to note that the 1219.80 high topped out right at the 1229 .618RT zone to the 1576 10/11/07 bull market high, but that was no surprise to the Trading Service members.
The upside resistance remains at the 1100 200DEMA, in addition to the 1103.52 and 1102.83 closing highs, and also the 1105.67 intraday high. The SPX 1040.78 low held the first time, but it is not a key price zone so the market remains vulnerable to more downside on Euro weakness. The next two price zones with some price symmetry are 1008 and 943. The technical traders and moving average market timers will have to participate if the SPX takes out that 1100-1106 resistance zone.

Have a good trading day!
Click here to find full details on Kevin’s courses including Trading with the Generals with over 20 hours of professional market strategies. And for a free trial to Kevin’s daily trading service, click here.
