Markets where I see strength growing…
Since late 2001 we have
been advising investors to look closely at resource related investments
and to look at commodity indexes. Until VERY recently there hasn’t been an easy
method for investors to emulate commodity price indexes without either buying
futures and rolling over continually or buying a fund that has either high
minimums or high fees that mimics a lesser index of commodities. That has now
changed with the Deutsche Bank commodity index Ishares, symbol
(
DBC |
Quote |
Chart |
News |
PowerRating).
The CRY or CRB index has now bounced off of both 200-MA support and long-term
trendline support levels and a move over this week’s highs likely means that
another leg up will ultimately develop in this secular theme. Therefore buying
DBC with stops under this week’s lows should the CRB index break this week’s
highs seems like a viable strategy for investors who do not have adequate
resource exposure, as a potential trade and starting point.
We still believe focusing on stocks that meet our rigid criteria along with the
strongest themes is the best strategy for this NARROWING market environment.
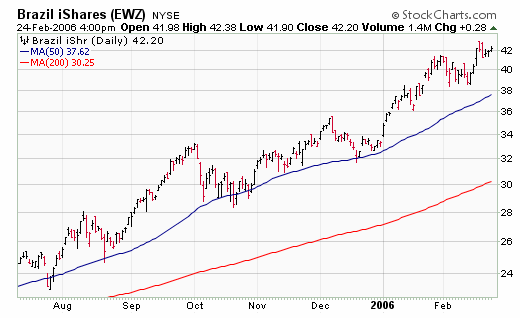
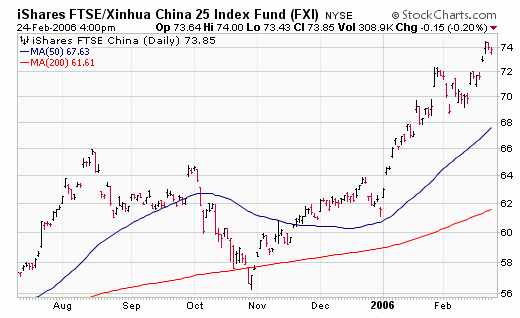
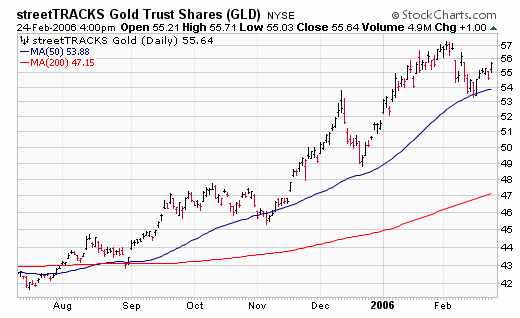
Brazil, China, South Africa and health care make up our favorite segments, with
smaller suggested allocation to other leaders such as commodity indexes (see
above), gold and gold stocks, oil and oil stocks, and Telecoms.
Continue watching for tops and weak segments that
are making topping formations.
Last week’s lows are holding thus far in
(
HHH |
Quote |
Chart |
News |
PowerRating),
(
GOOG |
Quote |
Chart |
News |
PowerRating),
(
AMZN |
Quote |
Chart |
News |
PowerRating), and
(
YHOO |
Quote |
Chart |
News |
PowerRating), but should the majority of these give
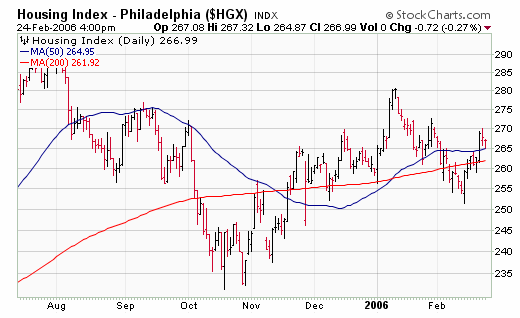
way, investors should take notice. Housing is still underperforming but is not
yet breaking down below 245.
(
RTH |
Quote |
Chart |
News |
PowerRating) and
(
XLY |
Quote |
Chart |
News |
PowerRating) have bounced and then
retreated but not yet broken significant level mentioned (93 and 32
respectively).
We suspect that the action of Utilities and bonds
is becoming more and more important in correctly assessing the outlook of the
markets. The traditional business cycle would call for inflation to begin rising
rapidly some time ago, and imminently, but it has not yet done so, particularly
at the core level. Yet there are many analysts who believe that inflation is
just late this time and will start to reflect higher commodity prices NOW.
We have argued that the impact of positive
deflation being exported from China and EM’s to the rest of the world is keeping
inflation under control in a way that has never happened before and that
inflationary pressures AT THE CONSUMER LEVEL are likely to remain substantially
muted because of the continual flow of cheaper and cheaper goods coming out of
Asia despite higher commodity prices. This would mean that supplies to
Asia/China and asset prices in general can continue moving higher while bond
rates and policy tightening that would normally follow a substantial uptick in
inflation will be much less during this cycle than typical. Investors should
monitor the debate here — is inflation taking off or not. If it is it would mean
MUCH more tightening that would not only create an inverted yield curve but also
high real rates that would choke off economic growth and the stock market and
lead to a hard landing recession ahead. If inflation can stay fairly well tamed,
then a softer-landing can develop in the US and the global economy can continue
to move slowly ahead, with markets likely to be ok and not negative. Remember
the magic key to figuring out what is happening — LET THE MARKETS SIGNAL A
SUSPECTED SCENARIO BEFORE ADOPTING IT.
Thus bonds are likely to be the arbiter of this
debate. If bonds start to break down and evidence of consumer inflation moving
quite higher mounts, then the inflation NOW scenario is developing. If bonds can
hold up and consumer inflation does not move significantly higher, then the
deflation-holding-inflation-in-check scenario is obtaining. So far the
inflationists have been wrong — but let’s let the markets tell the tale. THIS is
why monitoring bonds is critical for investors at this point.
(
IEF |
Quote |
Chart |
News |
PowerRating) under 81
and
(
TLT |
Quote |
Chart |
News |
PowerRating) under 87.5 joined by Utilities breaking December’s lows would be
an indication that rates may be ticking up more than expected, and this threat
still bears watching. Until then, and unless consumer inflation upticks in
substantially surprising fashion, we believe the muted inflation scenario
deserves the benefit of the doubt as inflation has not reacted normally in this
cycle thus far, nor have bonds.
Since global equities and groups have
substantially outperformed US markets since the 2002 bull market began, we’ve
strived to discuss SOME of our favorite themes and global markets in addition to
simply following our basic US growth strategy of buying strictly only those
stocks meeting our rigid criteria and selling short those doing the same on
breakouts. So far over the last quarter or so, this simple strategy has done
quite well too.
We are continuing to suggest more than normal
caution and milder than normal allocation to top global themes, and for
investors to expect volatility and less than optimum markets. There are risks,
the Fed is tightening, and a US slowdown may be materializing. Therefore
cautious exposure, trading in and out with minor trends, is probably yet again
the best approach to 2006.
Our model portfolio followed in TradingMarkets.com with specific entry/exit/ops
levels from 1999 through May of 2003 was up 41% in 1999, 82% in 2000, 16.5% in
2001, 7.58% in 2002, and we stopped specific recommendations up around 5% in May
2003 (strict following of our US only methodologies should have had portfolios
up 17% for the year 2003) — all on worst drawdown of under 7%. This did not
include our foreign stock recommendations that had spectacular performance in
2003.
Over the past week in our Top RS/EPS New Highs list published on
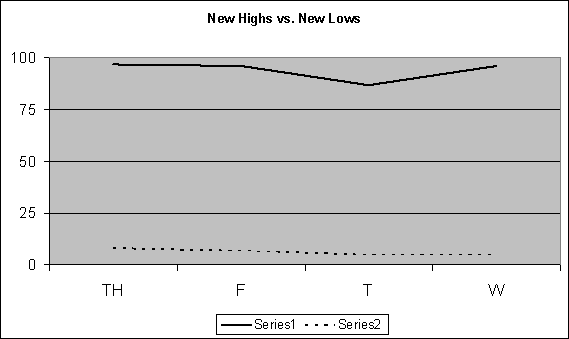
TradingMarkets.com, we had readings of 97, 96, 87 and 96 with 9 breakouts of 4+
week ranges, AXA & MVCO as valid trades and no close calls. This week, our
bottom RS/EPS New Lows recorded readings of 8, 7, 5 and 5 with 9 breakdowns of
4+ week ranges, no valid trades and no close calls. The “model†portfolio of
trades meeting criteria is now long TRAD, CIB, GG, CHS, RY, RVSN, AXA and MVCO.
We’ve already suggested tightening up stops a bit in all of these, and profits
should be locked in on all but the recent trades of the last couple weeks.
Mark Boucher has been ranked #1 by Nelson’s World’s Best
Money Managers for his 5-year compounded annual rate of return of 26.6%.
Boucher began trading at age 16. His trading helped finance his education at the
University of California at Berkeley, where he graduated with honors in
Economics. Upon graduation, he founded Investment Research Associates to finance
research on stock, bond, and currency trading systems. Boucher joined forces
with Fortunet, Inc. in 1986, where he developed models for hedging and trading
bonds, currencies, futures, and stocks. In 1989, the results of this research
were published in the Fortunet Trading Course. While with Fortunet, Boucher also
applied this research to designing institutional products, such as a hedging
model on over $1 billion of debt exposure for the treasurer of Mead, a Fortune
500 company.
For those not familiar with
our long/short strategies, we suggest you review my book The Hedge Fund Edge, my
course “The Science of Trading,” my video seminar, where I discuss many new
techniques, and my latest educational product, the interactive training module.
Basically, we have rigorous criteria for potential long stocks that we call
“up-fuel,” as well as rigorous criteria for potential short stocks that we call
“down-fuel.” Each day we review the list of new highs on our “Top RS and EPS New
High List” published on TradingMarkets.com for breakouts of four-week or longer
flags, or of valid cup-and-handles of more than four weeks. Buy trades are taken
only on valid breakouts of stocks that also meet our up-fuel criteria. Shorts
are similarly taken only in stocks meeting our down-fuel criteria that have
valid breakdowns of four-plus-week flags or cup and handles on the downside. In
the U.S. market, continue to only buy or short stocks in leading or lagging
industries according to our group and sub-group new high and low lists. We
continue to buy new long signals and sell short new short signals until our
portfolio is 100% long and 100% short (less aggressive investors stop at 50%
long and 50% short). In early March of 2000, we took half-profits on nearly all
positions and lightened up considerably as a sea of change in the
new-economy/old-economy theme appeared to be upon us. We’ve been effectively
defensive ever since, and did not get to a fully allocated long exposure even
during the 2003 rally.
