Measuring initial lows after bull market tops
The following commentary
is from a TradingMarkets member Bill Wheeler. Bill recently conducted research
into Bull Market Tops and the ensuing selloffs. He presents his finding here.
If you have research you would like to share with TradingMarkets readers please
contact us so that we can work on publishing your work.
Ashton Dorkins
Editor-in-Chief
A few years ago, I decided to take full responsibility for my
stock portfolio and manage it myself. This is the first time I have ever traded
through a bull market top. I vaguely remember the media headlines during the
1987 crash, so I thought it would be prudent to try and find some
characteristics that accompany a market apex and the initial sell off.
Using the SPX as the benchmark, I examined five tops 1980, 1987, 1990, 1998, and
2000. My initial observation was to see if any negative divergences occurred
using the following indicators – market breadth, RSI, McClellan oscillator and
Telechart 2005’s money stream. Using a 14 period RSI, a negative divergence
occurred just before the top of 1990. I did not observe consistence divergences
during the other tops, so I expanded my study. Using significant swing points
before the market tops, I calculated price increases ranged from 12.8 % (1990)
to 50.6 % (1980) in periods from one to nine months. The SPX rose 13.6 % from
October 13, 2005 to May 8, 2006, a seven-month period.
The following chart of the 1990 Bull Market Top illustrates the swing low before
and after the July top with a negative divergence.

I wanted to measure initial swing lows after a market top and what might
indicate they have occurred. I calculated price decreases, trading days and
observed the other indicators mentioned above. SPX price declines ranged from
11.7 % (1980) to 21 % (1998). Borrowing what I have learned from Kevin Haggerty,
the best correlation to the price lows might be measured when looking at market
breadth and RSI.
Haggerty uses moving average of market breadth (MB) and volume ratio to measure
extremes. He defines MB oversold as less than -700 and very oversold as less
than -900 (opposite for overbought). Adjusting the MB moving average to 3, only
2.3 % of the data since January 1, 1980 has been less than -900 (1.6 % was
greater than +900). Due to lack of historical data, volume data did not exist
for this study. Using 20 as extremely oversold for the 5-period RSI, only 4.6 %
of the data was less than 20 (10.6 % was greater than 80).
The following table outlines the readings of these indicators at SPX initial low
swing points:

The following two charts of the 2000 top help to further illustrate my findings.
From its March 24 2000 top the SPX declined 13.7 % and the 3 MB was at
-910 and the 5 RSI at 7.70. Using the pointer-tracking feature in TradeStation,
note that the 3 MB and 5 RSI came within one day of each other of reaching
extreme lows.

3 MB at April 14 – 17, 2000

I believe that there is some correlation between the 5 RSI, 3 MB and price all
reaching lows within one day of each other. Although this study only looked at 5
data points, a cursory review of other swing lows has the same correlation.
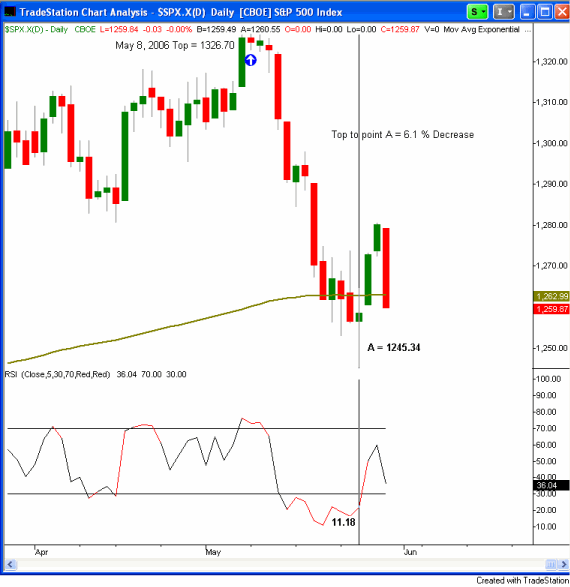
Using this hypothesis, one might ask “Have we reached an initial swing low from
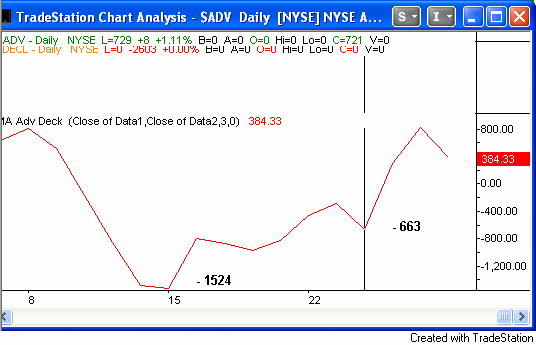
a possible May 8, 2006 top?†My answer is no. The following chart shows that
lows in the 5 RSI, 3 MB and price have not occurred within one day of each
other. An extreme low in the 3 MB of -1524 occurred on May 15, 2004 and it has
gradually increased since then. The 5 RSI low occurred on May 18, 2006 and on
the SPX hit a low on May 24, 2006 at 1245.34. On that day, the SPX had declined
6.1 % since May 8, 2006.


Bill Wheeler is a native of and lives
in Richmond, VA. He majored in mathematics and accounting in undergraduate
school, became a CPA and earned a MBA from Duke University.
A former consultant to small and mid size entities, Bill turned to his passion
— trading in 2004, focusing on swing and day trading. He is a believer in
education and has taken courses by Larry Connors and Kevin Haggerty.
