Mind the Lap: 4 Overbought Stocks for Traders
When markets move into rally mode, traders who buy weakness and sell strength know that it’s time to go bear hunting.
This is not how most traders respond, of course. When most traders hear that stocks are moving higher, their first thought is their same as the second thought, and their second thought is the same as their third: Buy. BUY. BUY!
In certain markets, markets that are coming off of major long term lows and have a great deal of upside momentum, this “buy high, sell higher” approach to trading can be successful. However, as a steady diet, we have found that this approach is not nearly as statistically valid as its adherents tend to suggest.
Consider the example of the lap up, a generally bullish price pattern. What is a lap up? It may be easier to understand what a lap up is if we compare it to its cousin, the gap up.
A gap up occurs when a market opens above the high of the previous trading session. The gap refers to the space between the high on Day One, and the open of Day Two. Generally speaking, gap ups are thought to be very bullish events, often signaling higher prices ahead.
A lap up is similar. A lap up occurs when a market opens above the close of the previous trading session. While not quite as powerful as a gap up in terms of expressing sometimes wildly bullish sentiment, the lap nevertheless reveals a market in which buyers are more than eager to bid share prices higher. As such, the lap up is very much a strong expression of bullish sentiment.
As we say often at TradingMarkets, bullish sentiment is good, but contextual. It is one thing for a strong stock to display powerfully bullish sentiment while it trades above the 200-day moving average. Our research, however, tells us that it is quite a different matter when a weak stock, trading below its 200-day moving average, displays these same lap-up, bullish sentiments.
Specifically, we found after examining millions of simulated short term stock trades between 1995 and 2007, that stocks that lapped up by 5% or more–and were trading below their 200-day moving averages–actually underperformed the average stock one-day, two-days and one-week later on average.
Click here to read our research into stocks that have experienced “lap ups” of 5% or more.
This may seem counterintuitive–that a stock that shows exceptionally bullish sentiment could at the same time be a stock that is likely to underperform in the short term. Again, though, we point to the context. The kind of bullish sentiment that traders see below the 200-day moving average is very different from the expressions of bullish sentiment above the 200-day moving average. Above the 200-day moving average, gap ups tend to reflect accelerations in trend, only infrequently being the sort of “exhaustion” moves that popular mythology assumes most gap ups or lap ups to be.
Below the 200-day moving average, on the other hand, we have a land of desperation, a place where stocks tend to rally briefly only to fall back again, time and time again. This is where stocks that have been held too long by longer term investors tend to dwell and where short sellers ply their trade. When we see bullish sentiment below the 200-day moving average, we know that it is best to be suspicious because, more often than not, the bullishness that develops below the 200-day moving average is fleeting and better bet against than rooted for.
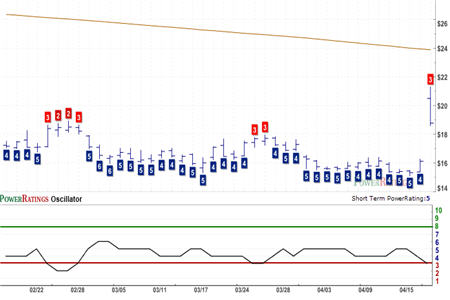
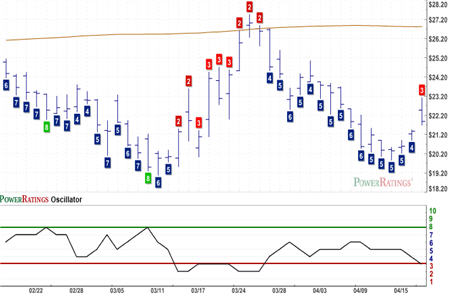
Three of the stocks in today’s report have Short Term PowerRatings of 3. Our research into short term stock price behavior revealed to us that stocks with Short Term PowerRatings of 3 tend to underperform the average stock after five days.
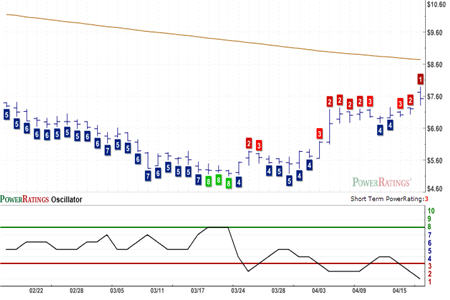
Traders should keep an eye on these stocks in the even that they continue to show strength below the 200-day moving average. This would likely bring the Short Term PowerRatings of these stocks even lower, making them all the more attractive as short selling candidates for traders who include betting against stocks among their trading methods.
We also have one stock with a Short Term PowerRating of 1. Stocks with Short Term PowerRatings of 1 have actually underperformed the average stock by a margin of almost 5 to 1 after five days. If there are stocks to be shorted on strength, stocks with Short Term PowerRatings of 1 are chief among them.
Avocent
(
AVCT |
Quote |
Chart |
News |
PowerRating). Short Term PowerRating 3. RSI(2): 96.61

Knoll
(
KNL |
Quote |
Chart |
News |
PowerRating). Short Term PowerRatings 3. RSI(2): 93.74

Omniture
(
OMTR |
Quote |
Chart |
News |
PowerRating). Short Term PowerRatings 3. RSI(2): 96.28

Qiao Xing Universal Telephone
(
XING |
Quote |
Chart |
News |
PowerRating). Short Term PowerRatings 1. RSI(2): 99.20

Join Larry Connors, CEO and founder of TradingMarkets, Friday at noon for a special presentation announcing the opening of our Swing Trading College. Our Swing Trading College has been one of our more popular products and we are happy to be making this 14-session, online course available to our readers and subscribers. The Conference Call will last for approximately 30 minutes.
Not only will Larry talk about the Swing Trading College, but also he will share with listeners a new method for swing trading exchange-traded funds, a strategy called “Double 7’s Strategy” that has performed impressively in historic testing, being correct over 79% of the time in both the NDX and the SPX from 1995 up through yesterday.
That’s Larry live Friday at noon for the TradingMarkets Swing Trading College. Spaces are limited, so click here to reserve your spot today.
David Penn is Senior Editor at TradingMarkets.com.
