Monday’s Stock Watch
The broader markets
turned in mixed results on top of disappointing economic data. Overall
volume was around average with no clear sign of dominance to the up or down
side. The number of new 52-week highs on the Nasdaq came in at a now typical
rate of over 30, and the NYSE had an encouraging number of 27. Blue chips turned
it on today while the tech sectors were mixed. Despite the semiconductor stocks
making up the worst performing sector, four new highs were made here. The stocks
on our watch list were mixed.
The Dow Jones Industrial Average
(
$INDU |
Quote |
Chart |
News |
PowerRating) closed up 0.23% to 9,851.56. The
S&P 500
(
$SPX |
Quote |
Chart |
News |
PowerRating) closed down 0.17%Â % to
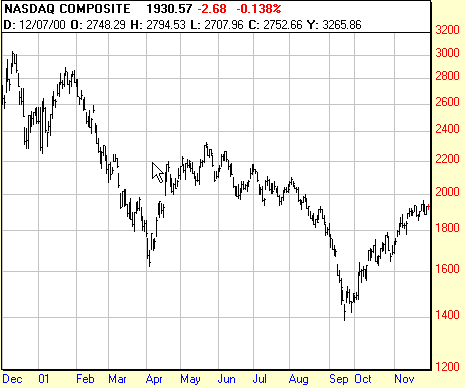
1,138.22. The Nasdaq [COMPQ | COMPQ] closed down
0.14% to 1,930.61.
Â
| Â | NYSE | NASDAQ |
| Advancing Issues | 1,552 |
1,772 |
| Declining Issues | 1,581 |
1,892 |
| Advancing Volume | 604,975,000 |
816,233,000 |
| Declining Volume |
708,591,000 |
956,455,000 |
| Total Volume | 1,330,557,000 |
1,787,801,000 |
| New 52-week Highs | 27 | 36 |
| New 52-week Lows | 4 | 2 |
| New 52-week Highs for Week |
99 | 175 |
| New 52-week Lows for Week |
25 | 7 |
Â
Weekly Perspective
This week the markets ran into
overhead resistance as the major indexes hesitated around key technical levels.
The Dow finished the week down 108.15 points for a loss of 1%. The S&P 500
closed down 10.89 points for a loss of 1%. The Nasdaq maintained its leadership
by ending the week up 27.38 points for a gain of 1%. Interestingly the Nasdaq
stalled at is 61.8% retracement level from the May high, the Dow shied away from
its psychological 10,000 mark, and the S&P 500 turned away from its downward
trend line.
Though every bull market is said to
climb a wall of fear, the number of new 52-week highs we see made each day is
encouraging. Technology remains the leadership, though we would like to see more
participation across the sectors. As Mark Boucher points out in his column, the
number of highs made on
the
Top
RS/EPS New Highs list is showing signs of life, but is not quite at the
consistent 20+ levels he would like to see. The strongest sectors this past week
were from the business related industries, medical related industries, and
semiconductors. From our watch list Pec Solutions continues to move north of its
pivot point, while there was much to be desired from the other stocks meeting
our fundamental and technical criteria.
Top sectors:
Airline Index
(
$XAL.X |
Quote |
Chart |
News |
PowerRating) up 1.71% to
88.72.
GSTI Hardware Sector
(
$GHA.X |
Quote |
Chart |
News |
PowerRating)
up 1.38% to 266.36.
S&P Transportation Index
(
TRX.X |
Quote |
Chart |
News |
PowerRating)
Losing sectors:
 Semiconductor Index
(
$SOX.X |
Quote |
Chart |
News |
PowerRating) down 2.66%
to 518.96
GSTI Software Index
(
$GSO.X |
Quote |
Chart |
News |
PowerRating) down
2.25% to 173.24.
CBOE Internet Sector
(
INX |
Quote |
Chart |
News |
PowerRating) down
1.22% to 130.96.
Sectors With New Highs:
Biotechnology – 3
Business Equipment – 2
Business Services – 3
Medical Appliances and
Equipment – 5
Medical Laboratories and
Research – 1
Semiconductor Integrated Circuits – 3
Semiconductor Memory Chips – 1
Â
Watch List Action
Pec
Solutions
(
PECS |
Quote |
Chart |
News |
PowerRating) is still pushing its way higher with a gain of 2.83% on
less than average volume. This stock has been exhibiting exceptional behavior
since breaking out of its cup-and-handle a couple of weeks ago.
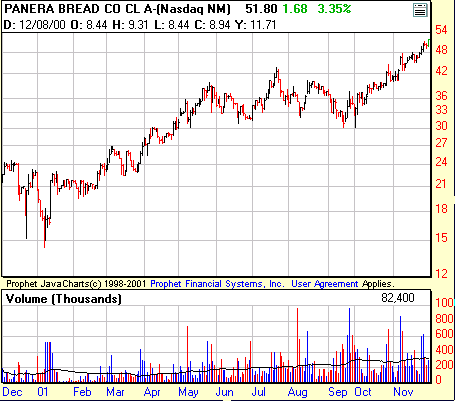
Panera Bread Co.
(
PNRA |
Quote |
Chart |
News |
PowerRating) made a nice 3.35% gain for an accumulation day,
right on track with the strong trend it has established. From looking at the
volume chart below we can see the stock has been able to advance nicely despite
a couple of clear distribution days. At some point this stock will pull back and
we will look to see if volume dries up as the price declines. This will indicate
buyers clearly favor the stock. The last two down days have experienced this
behavior.
Â
Recent Breakouts
We monitor the action of Recent Breakouts as an indicator
of the market health for IT traders. When breakouts are acting well, this is a
good sign for the likelihood of further sustainable breakouts. When breakouts
are failing, IT traders should be even more cautious.
American Healthways Inc.
(
AMHC |
Quote |
Chart |
News |
PowerRating) up 5.11% on
average volume.
Copart Inc.
(
CPRT |
Quote |
Chart |
News |
PowerRating) up 2.32% on above average volume.
Epiq Systems
(
EPIQ |
Quote |
Chart |
News |
PowerRating) down 1.04% on average volume for
a distribution day.
Genesis Microchip
(
GNSS |
Quote |
Chart |
News |
PowerRating) down 2.18% on
below average volume.
Krispy Kreme Doughnuts
(
KKD |
Quote |
Chart |
News |
PowerRating) up 2.90% on
below average volume.
MTR Gaming Group
(
MNTG |
Quote |
Chart |
News |
PowerRating) down 0.58% on average
volume.
Nvidia Corp.
(
NVDA |
Quote |
Chart |
News |
PowerRating)
up 1.92% on average volume.
Â
Company Name |
Symbol |
12 Month RS |
Price |
Price Change |
Average Volume |
| American Healthways Inc. | ( AMHC | Quote | Chart | News | PowerRating) |
99 | 33.10 | + 1.61 | 214,800 |
| Copart Inc. | ( CPRT | Quote | Chart | News | PowerRating) |
94 | 34.28 | + 0.78 | 816,800 |
| EPIQ Systems | ( EPIQ | Quote | Chart | News | PowerRating) |
95 | 29.26 | – 0.31 | 205,200 |
| Genesis Microchip | ( GNSS | Quote | Chart | News | PowerRating) |
99 | 56.84 | – 1.36 | 2,432,300 |
| Krispy Kreme Doughnuts | ( KKD | Quote | Chart | News | PowerRating) |
94 | 37.25 | + 1.05 | 854,000 |
| MTR Gaming Group | ( MNTG | Quote | Chart | News | PowerRating) |
96 | 13.56 | – 0.08 | 304,100 |
| Nvidia Corp. | ( NVDA | Quote | Chart | News | PowerRating) |
96 | 54.64 | + 1.03 | 9,986,100 |
| Panera Bread Co. | ( PNRA | Quote | Chart | News | PowerRating) |
96 | 51.80 | + 1.68 | 320,700 |
| Pec Solutions | ( PECS | Quote | Chart | News | PowerRating) |
99 | 35.99 | + 0.99 | 431,300 |
Â
Stocks Forming a Handle
THQ Inc.
(
THQI |
Quote |
Chart |
News |
PowerRating) up 2.30% on above average volume.
Company Name |
Symbol |
12 Month RS |
Price |
Price Change |
Average Volume |
| THQ Inc. | ( THQI | Quote | Chart | News | PowerRating) |
96 | 57.29 | + 1.29 | 1,500,600 |
Â
Stocks Building A Base
Ebay
(
EBAY |
Quote |
Chart |
News |
PowerRating) up 2.76% on below average
volume for an accumulation day.
Metro One Telecomm Inc
(
MTON |
Quote |
Chart |
News |
PowerRating) down 3.58%
below average volume for a distribution day.
Company Name |
Symbol |
12 Month RS |
Price |
Price Change |
Average Volume |
| Ebay | ( EBAY | Quote | Chart | News | PowerRating) |
92 | 68.07 | + 1.83 | 9,130,800 |
| Metro One Telecomm Inc | ( MTON | Quote | Chart | News | PowerRating) |
96 | 34.38 | – 1.28 | 718,000 |
Â
Â