Monday’s Stock Watch
The markets continue to get hammered
with earnings
warnings and uninspiring economic reports. For the past week, the NYSE made one day
of distribution, and no accumulation, while the Nasdaq made two days of
distribution and no accumulation. The 52-week lows continue to over shadow the
near non-existent highs list, and Mark Boucher‘s
Top
RS and ER List and
Bottom RS and ER List maintain a bearish bias.
Concerns over a conflict with Iraq, as well as a
weak economy have been attributed to negative market psychology, though there is
hope that earnings season will change things, as General Electric announces next
Friday. The market has been given several motives for buyers to step up, ranging
from positive econ news, to key technical levels, but nothing has helped us
rally for more than a couple of days. This market is sick, and until we are able
to respond positively to the news, there is no reason to bet against the bear.
Stocks on this report had a rough go this week. Two
members of the breakout list were removed, while other members have been posting
heavy distribution. As mentioned several times in this report, and in other
columns on the site, this is no market to go long in. Use this report as a
measure of how well the stocks possessing the strongest of fundamental and technical
properties hold up, as it is also a measure of overall market strength.
From Friday’s action:
Market breadth was negative, with NYSE
declining issues over advancing issues by a ratio of 2.92, and down volume over
up volume by a 5.85 ratio. Nasdaq declining issues over advancing issues came in
at 2.37, and down volume beat up volume by a 4.57 ratio.
The Dow Jones Industrial Average
(
$INDU.X |
Quote |
Chart |
News |
PowerRating) closed -2.44% at
7528.40. The S&P 500
(
$SPX.X |
Quote |
Chart |
News |
PowerRating)
closed -2.24% at 800.58.
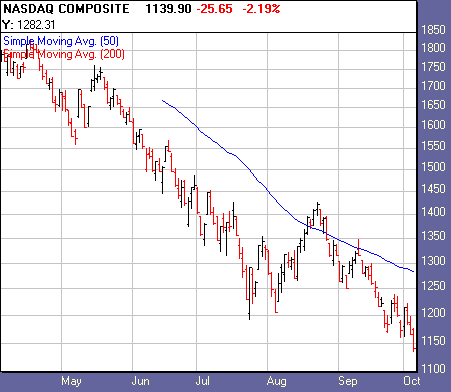
The Nasdaq
(
$COMPQ |
Quote |
Chart |
News |
PowerRating) closed -2.20% at 1139.90.

754
989
Declining Issues
2,297
2,309
253,441,000
273,216,000
1,484,319,000
1,268,782,000
Total
Volume
1,771,362,000
1,589,228,000
Highs
1
1
177
75
Top sectors:
Health Services, Medical Appliances & Equipment, and
Leisure-Gaming.
Losing sectors:
Semiconductors, Major Airlines, Software, and Telecoms.
Watch List Action:
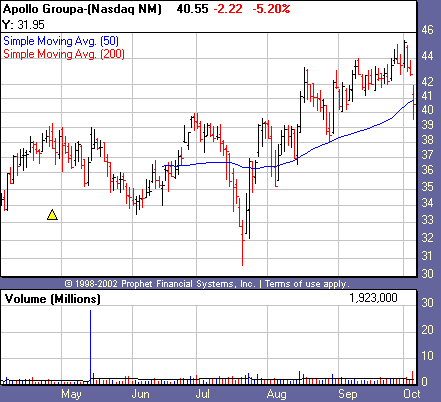
Apollo Group
(
APOL |
Quote |
Chart |
News |
PowerRating) gave in to market pressures Friday, as it sold off to
its 50-day moving average. This one is still above its pivot point, though the
outlook for this one has turned negative.

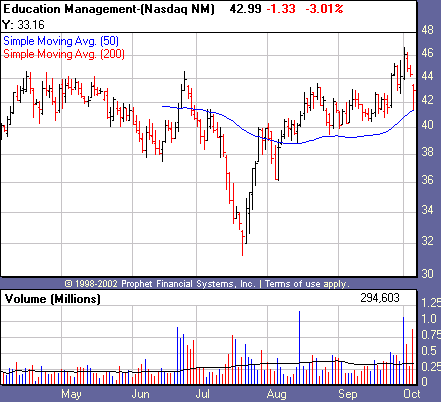
Education Management Corp.
(
EDMC |
Quote |
Chart |
News |
PowerRating) also fell apart Friday, though has yet to
sell off more than 7% below its pivot point. As with Apollo above, this one’s
outlook has taken a turn for the worse.

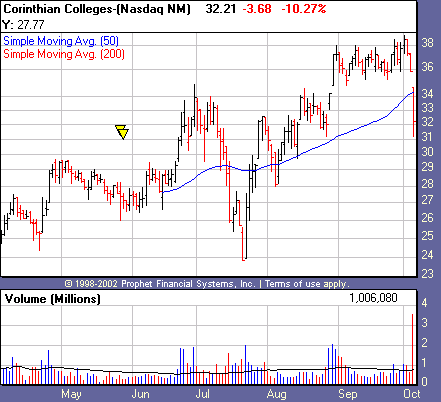
Corinthian Colleges
(
COCO |
Quote |
Chart |
News |
PowerRating) has sold its way off our breakout list, as it
fell more than 10% below its buy point. Another victim of the bear.

Recent Breakouts
size=2>We monitor the action of Recent Breakouts as an indicator of
the market health for IT traders. When breakouts are acting well, this is a good
sign for the likelihood of further sustainable breakouts. When breakouts are
failing, IT traders should be even more cautious.
| color=#ffffff size=2>Company Name | color=#ffffff size=2>Symbol | color=#ffffff size=2>12 Month RS | color=#ffffff size=2>Price | color=#ffffff size=2>Price Change | color=#ffffff size=2>Average Volume | Pivot | 52-Week High |
Apollo Group | ( APOL | Quote | Chart | News | PowerRating) | 94 | 40.55 | -2.33 | 2,238,400 | 39.60 | 45.37 |
Alliant Techsystems | ( ATK | Quote | Chart | News | PowerRating) | 84 | 65.91 | -1.29 | 429,500 | 69.95 | 76.93 |
Corinthian Colleges | ( COCO | Quote | Chart | News | PowerRating) | 97 | 32.21 | -3.69 | 726,700 | 34.69 | 38.75 |
Education Mgt. Co. | ( EDMC | Quote | Chart | News | PowerRating) | 89 | 42.99 | -1.34 | 339,200 | 43.19 | 46.65 |
Hovnanian Enterprises | ( HOV | Quote | Chart | News | PowerRating) | 97 | 33.04 | -1.17 | 689,300 | 33.56 | 40.56 |
International Game Technology | ( IGT | Quote | Chart | News | PowerRating) | 92 | 67.35 | -1.47 | 905,700 | 66.70 | 70.65 |
Alliant Techsystems
(
ATK |
Quote |
Chart |
News |
PowerRating) is now off the
list as it sold off more than 7% from its pivot buy point.
Corinthian Colleges
(
COCO |
Quote |
Chart |
News |
PowerRating) is now off the
list as it sold off more than 7% from its pivot buy point.
Stocks Forming a Handle
| color=#ffffff size=2>Company Name | color=#ffffff size=2>Symbol | color=#ffffff size=2>12 Month RS | color=#ffffff size=2>Price | color=#ffffff size=2>Price Change | color=#ffffff size=2>Average Volume | Pivot |
Mid Atlantic Medical Services | ( MME | Quote | Chart | News | PowerRating) | 97 | 37.18 | -1.28 | 455,000 | 38.83 |
Bed Bath & Beyond
(
BBBY |
Quote |
Chart |
News |
PowerRating) has been
removed from the list after its sold off 15% from the high of its handle.
Stocks Building A Base
color=#ffffff size=2>Company Name | color=#ffffff size=2>Symbol | color=#ffffff size=2>12 Month RS | color=#ffffff size=2>Price | color=#ffffff size=2>Price Change | color=#ffffff size=2>Average Volume |
Brown & Brown | ( BRO | Quote | Chart | News | PowerRating) | 74 | 30.17 | -0.58 | 231,600 |
Wellpoint Health Network | ( WLP | Quote | Chart | News | PowerRating) | 91 | 77.62 | -0.63 | 1,457,600 |
href=”mailto:danielb@tradingmarkets.com”>danielb@tradingmarkets.com
If you are new to the “IT” strategy, be sure to
take a look at our
intermediate-term online trading course.
Intermediate-Term Traders
Report is posted on
Tuesdays and Fridays. For other intermediate-term commentary, be sure to read
Mark Boucher (Fridays),
Tim Truebenbach (Tuesdays and Thursdays), and
Gary Kaltbaum (Mondays and Thursdays).
