Monday’s Stock Watch
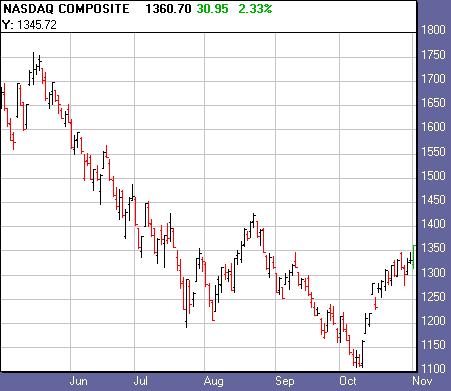
The major indexes posted
their fourth week in a row of gains, as the NYSE made one day of
minor accumulation and three days of distribution (two of which were minor), and
the Nasdaq made three days of accumulation and one day of distribution. The
indexes have been trading in a tight range for the past two weeks, which may
very well be resolved Wednesday when the Fed announces whether or not they will
cut interest rates.
New 52-week highs have been holding a slight
advantage over the new 52-week lows, and Mark Boucher‘s
Top
RS and ER List has maintained its bullish bias over the
Bottom RS and ER List.
We have removed three stocks form this report during
the past week, though have three candidates primed to breakout from the handles
list. This is still a shaky market, and not an ideal buying environment. The
search goes on for stocks meeting our top technical and fundamental criteria.
From Friday’s action:
Market breadth was positive, with NYSE
advancing issues over declining issues by a ratio of 2.55, and up volume over
down volume by a 2.96 ratio. Nasdaq advancing issues over declining issues came
in at 2.09, and up volume beat down volume by a 6.53 ratio.
Dow Jones Industrial Average
(
$INDU.X |
Quote |
Chart |
News |
PowerRating)
closed +1.43%
at 8517.64. The S&P 500
(
$SPX.X |
Quote |
Chart |
News |
PowerRating)
closed +1.71% at
900.96.
The Nasdaq
(
$COMPQ |
Quote |
Chart |
News |
PowerRating) closed +2.32% at
1,360.71.

2,199
2,206
Declining Issues
853
1,046
1,034,454,000
1,628,714,000
367,773,000
198,156,000
Total
Volume
1,411,484,000
1,576,517,000
Highs
14
17
11
6
Top sectors:
Short-term: Internet, Telecoms, Broker/Dealers,
Computer Hardware.
Long-term: Gold, Defense, Consumer.
Watch List Action:
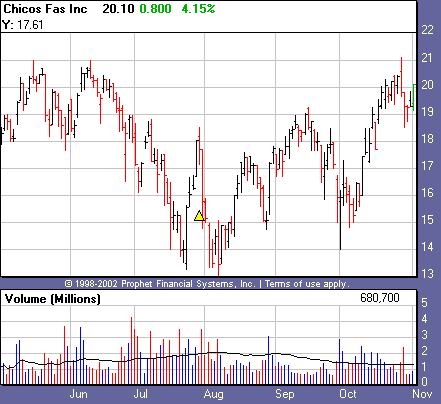
From our handles list, Chicos FAS
(
CHS |
Quote |
Chart |
News |
PowerRating) is poised to break out of a five
month base. The stock made an accumulation day Friday. Ideally we’d like to see
the price action in the handle gradually slope down with the volume descending.
Heavy distribution on Tuesday is a red flag.

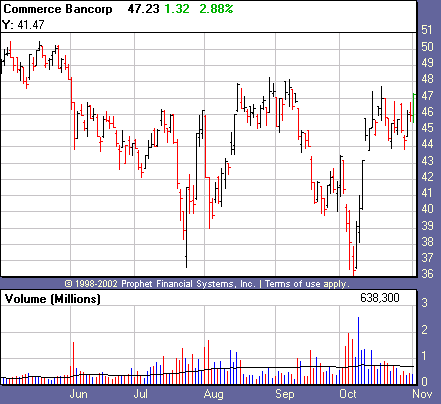
Also poised to break out of a five month base is Commerce Bancorp.
(
CBH |
Quote |
Chart |
News |
PowerRating).
The stock has formed a jerky handle, though volume has been declining. The stock
meets our top fundamental and technical criteria, and is a member of the strong
regional bank sector.

Recent Breakouts
size=2>We monitor the action of Recent Breakouts as an indicator of
the market health for IT traders. When breakouts are acting well, this is a good
sign for the likelihood of further sustainable breakouts. When breakouts are
failing, IT traders should be even more cautious.
| color=#ffffff size=2>Company Name | color=#ffffff size=2>Symbol | color=#ffffff size=2>12 Month RS | color=#ffffff size=2>Price | color=#ffffff size=2>Price Change | color=#ffffff size=2>Average Volume | Pivot | 52-Week High |
Apollo Group | ( APOL | Quote | Chart | News | PowerRating) | 92 | 42.22 | -0.87 | 2,540,700 | 39.60 | 46.15 |
Coach Inc. | ( COH | Quote | Chart | News | PowerRating) | 95 | 31.40 | -0.47 | 991,100 | 29.80 | 33.09 |
Education Mgt. Co. | ( EDMC | Quote | Chart | News | PowerRating) | 58 | 36.99 | -5.39 | 447,100 | 41.87 | 46.65 |
Hovnanian Enterprises | ( HOV | Quote | Chart | News | PowerRating) | 98 | 38.28 | +0.80 | 811,600 | 32.90 | 40.56 |
International Game Technology | ( IGT | Quote | Chart | News | PowerRating) | 93 | 77.04 | +1.85 | 1,027,800 | 75.47 | 77.22 |
Wellpoint Health Network | ( WLP | Quote | Chart | News | PowerRating) | 85 | 76.15 | -5.86 | 1,507,500 | 79.05 | 85.63 |
WLP traded to 7% below pivot, we’ll keep it on
the list as long as it stays above 8%.
EDMC is coming off as it dropped over 15% below
its pivot.
Stocks Forming a Handle
| color=#ffffff size=2>Company Name | color=#ffffff size=2>Symbol | color=#ffffff size=2>12 Month RS | color=#ffffff size=2>Price | color=#ffffff size=2>Price Change | color=#ffffff size=2>Average Volume | Pivot |
Commerce Bancorp. | ( CBH | Quote | Chart | News | PowerRating) | 83 | 47.23 | +1.56 | 720,600 | 47.80 |
Chicos FAS | ( CHS | Quote | Chart | News | PowerRating) | 96 | 20.10 | -0.31 | 1,286,900 | 21.19 |
Ross Stores Inc. | ( ROST | Quote | Chart | News | PowerRating) | 89 | 44.06 | -0.75 | 1,074,600 | 45.59 |
Stocks Building A Base
color=#ffffff size=2>Company Name | color=#ffffff size=2>Symbol | color=#ffffff size=2>12 Month RS | color=#ffffff size=2>Price | color=#ffffff size=2>Price Change | color=#ffffff size=2>Average Volume | Pivot |
None |
href=”mailto:danielb@tradingmarkets.com”>danielb@tradingmarkets.com
If you are new to the "IT" strategy, be sure to
take a look at our
intermediate-term online trading course.
Intermediate-Term Traders
Report is posted on
Tuesdays and Fridays. For other intermediate-term commentary, be sure to read
Mark Boucher (Fridays),
Tim Truebenbach (Tuesdays and Thursdays), and
Gary Kaltbaum (Mondays and Thursdays).
