Monday’s Stock Watch
It was a losing week for
the major indexes as the NYSE made two accumulation days, and the
Nasdaq three accumulation days. Overall volume was below average as ongoing
tension with Iraq kept players sidelined.
Market breadth continues to show a slight negative
bias, with New 25-week Lows showing a slight edge over the Highs, though both
lists are producing relatively low numbers. Mark Boucher‘s
Bottom RS and ER List has been flashing a bearish reading as it has came in
with consistent readings over 20 for the week, while the
Top
RS and ER List remained flat.
Stocks on our watch list did well for the week. We
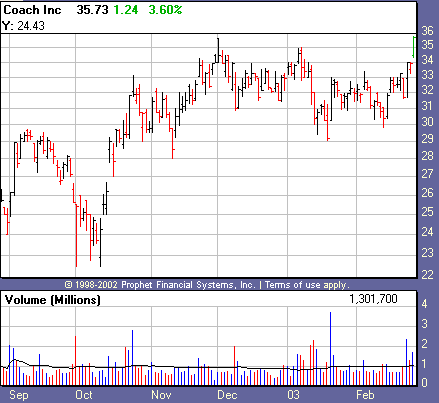
had another breakout from Coach
(
COH |
Quote |
Chart |
News |
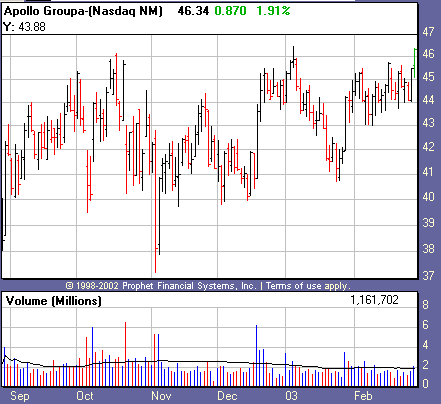
PowerRating), and Apollo Group
(
APOL |
Quote |
Chart |
News |
PowerRating) showed a
nice gain though failed to produce a new breakout. The search goes on for stocks
meeting our top technical and fundamental criteria.
From Friday’s action:
Market breadth was positive, with NYSE
advancing issues over declining issues by a ratio of 1.48, and up volume over
down volume by a 1.70 ratio. Nasdaq advancing issues over declining issues came
in at 1.04, and up volume beat down volume by a 3.02 ratio.
Dow Jones Industrial Average
(
$INDU.X |
Quote |
Chart |
News |
PowerRating)
closed +0.07%
at 7,891.01. The S&P 500
(
$SPX.X |
Quote |
Chart |
News |
PowerRating)
closed +0.46% at
841.15.
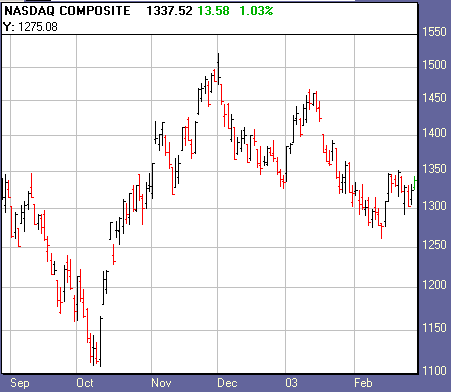
The Nasdaq
(
$COMPQ |
Quote |
Chart |
News |
PowerRating) closed
+1.02% at
1,337.54.

1,786
1,687
Declining Issues
1,226
1,557
811,323,000
983,390,000
466,505,000
318,254,000
Total
Volume
1,292,760,000
1,330,718,000
Highs
15
3
15
15
Top sectors:
Internet, Gold and Silver, Software, Drugs, and
Fiber Optics.
Watch List Action:
Coach Inc.
(
COH |
Quote |
Chart |
News |
PowerRating) successfully broke out Friday as it cruised past its its
most recent consolidation high on over 60% of its daily average volume. The
stock closed at the top of its range for a new all-time high.

Apollo Group
(
APOL |
Quote |
Chart |
News |
PowerRating) went through its pivot buy point for an accumulation
day, though did not generate at least the volume needed for a buy signal.
Remember, we need to see volume at lest 40% over its daily average, and the more
the better. APOL also closed at the top of its daily range, though came just
short of a new 52-weekhigh.

Recent Breakouts
size=2>We monitor the action of Recent Breakouts as an indicator of
the market health for IT traders. When breakouts are acting well, this is a good
sign for the likelihood of further sustainable breakouts. When breakouts are
failing, IT traders should be even more cautious.
| color=#ffffff size=2>Company Name | color=#ffffff size=2>Symbol | color=#ffffff size=2>12 Month RS | color=#ffffff size=2>Price | color=#ffffff size=2>Price Change | color=#ffffff size=2>Average Volume | Pivot | 52-Week High |
Coach Inc. | ( COH | Quote | Chart | News | PowerRating) | 92 | 35.73 | +1.24 | 991,100 | 28.35 | 35.70 |
Garmin Ltd. | ( GRMN | Quote | Chart | News | PowerRating) | 96 | 33.35 | +0.32 | 489,500 | 23.46 | 32.07 |
International Game Technology | ( IGT | Quote | Chart | News | PowerRating) | 84 | 78.58 | +0.94 | 1,121,100 | 74.84 | 80.10 |
Stocks Forming a Handle
| color=#ffffff size=2>Company Name | color=#ffffff size=2>Symbol | color=#ffffff size=2>12 Month RS | color=#ffffff size=2>Price | color=#ffffff size=2>Price Change | color=#ffffff size=2>Average Volume | Pivot |
Apollo Group | ( APOL | Quote | Chart | News | PowerRating) | 89 | 46.34 | +0.87 | 1,955,600 | 45.84 |
CECO | ( CECO | Quote | Chart | News | PowerRating) | 85 | 46.50 | +0.64 | 882,100 | 48.07 |
Expeditors International of Washington | ( EXPD | Quote | Chart | News | PowerRating) | 85 | 34.19 | +0.14 | 909,300 | 34.54 |
UCBH Holdings | ( UCBH | Quote | Chart | News | PowerRating) | 79 | 42.10 | +0.51 | 181,300 | 45.20 |
Stocks Building A Base
color=#ffffff size=2>Company Name | color=#ffffff size=2>Symbol | color=#ffffff size=2>12 Month RS | color=#ffffff size=2>Price | color=#ffffff size=2>Price Change | color=#ffffff size=2>Average Volume | Pivot |
None |
If you are new to the "IT" strategy, be sure to
take a look at our
intermediate-term online trading course.
Intermediate-Term Traders
Report is posted on
Tuesdays and Fridays. For other intermediate-term commentary, be sure to read
Mark Boucher (Fridays),
Tim Truebenbach (Tuesdays and Thursdays), and
Gary Kaltbaum (Mondays and Thursdays).
