Monday’s Stock Watch
The markets got crushed
this shortened week, as volume on the exchanges made for one
accumulation day and one distribution day. Friday’s action had the major
indexes breaking below the necklines of head-and-shoulders topping patterns,
though lack of volume indicates less conviction for the move. From the S&P 500
monthly chart, an ugly picture is presented as the high of last month’s bearish
engulfing bar shows a test to the neckline of a massive head-and-shoulders
pattern.
Sentiment-wise, there has been very little to cheer
over. Earnings season has provided nothing but fodder for the bears.
Geopolitical issues with Iraq, North Korea and Venezuela continue to drag on as
they undoubtedly keep cautious money managers at bay. And Gold hit a new
five-year high Friday, suggesting a defensive move in asset allocation.
In the breadth department, New 52-week Lows have
picked up steam over the Highs list, though both lists are producing relatively
low numbers. Mark Boucher‘s
Top
RS and ER List and
Bottom RS and ER List are giving unbiased readings with numbers below 20,
though the Bottom list has come to life after a long drought of inactivity.
Stocks on our watch lists have hung in there. We saw
some distribution for the week, though price levels are holding. As always, the
search goes on for stocks meeting our top technical and fundamental criteria.
From Friday’s action:
Market breadth was negative, with NYSE
declining issues over advancing issues by a ratio of 2.89, and down volume over
up volume by a 4.97 ratio. Nasdaq declining issues over advancing issues came in
at 2.63, and down volume beat up volume by a 6.85 ratio.
The Dow Jones Industrial Average
(
$INDU.X |
Quote |
Chart |
News |
PowerRating)
closed -2.48%
at 8,131.01. The S&P 500
(
$SPX.X |
Quote |
Chart |
News |
PowerRating)
closed -2.92% at
861.40. The Nasdaq
(
$COMPQ |
Quote |
Chart |
News |
PowerRating) closed -3.32% at
1,342.15.

784
895
Declining Issues
2,327
2,366
249,649,000
198,759,000
1,236,081,000
1,356,154,000
Total
Volume
1,500,459,000
1,569,021,000
Highs
10
5
39
22
Top sectors:
Fiber Optics, Gold and Silver, Internet and
Computer Security.
Watch List Action:
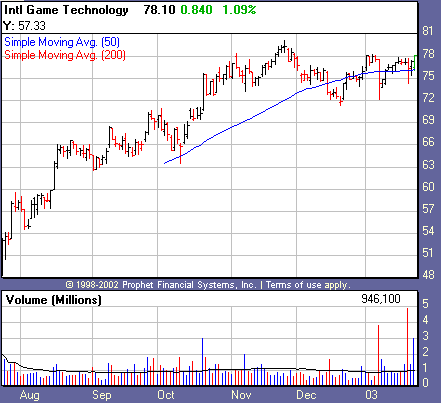
Defying the overall market action, International Game Technology
(
IGT |
Quote |
Chart |
News |
PowerRating) put
in an accumulation day Friday as it remains poised to break out of a base. Be careful here,
though. Two recent days of heavy distribution made in the last three
weeks is a major red flag for potential new buyers. We’ve been tracking this as
a breakout since September, with a pivot buy point of 66.70.

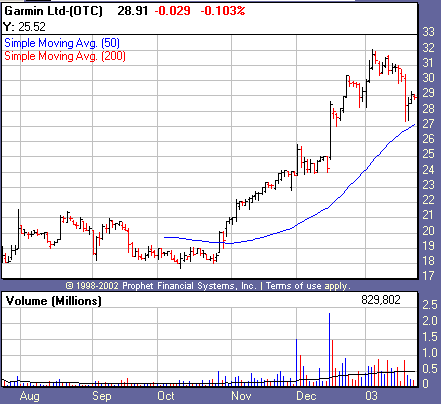
Recovering from a heavy distribution day Tuesday, Garmin Ltd.
(
GRMN |
Quote |
Chart |
News |
PowerRating) has
been creeping higher, though on lower volume. The stock is continuing to show
signs of a lack of buying interest.

Recent Breakouts
size=2>We monitor the action of Recent Breakouts as an indicator of
the market health for IT traders. When breakouts are acting well, this is a good
sign for the likelihood of further sustainable breakouts. When breakouts are
failing, IT traders should be even more cautious.
| color=#ffffff size=2>Company Name | color=#ffffff size=2>Symbol | color=#ffffff size=2>12 Month RS | color=#ffffff size=2>Price | color=#ffffff size=2>Price Change | color=#ffffff size=2>Average Volume | Pivot | 52-Week High |
Coach Inc. | ( COH | Quote | Chart | News | PowerRating) | 87 | 32.10 | -0.55 | 872,300 | 28.35 | 35.70 |
Garmin Ltd. | ( GRMN | Quote | Chart | News | PowerRating) | 95 | 28.89 | -0.05 | 404,400 | 23.46 | 31.35 |
Hovnanian Enterprises | ( HOV | Quote | Chart | News | PowerRating) | 74 | 32.05 | +0.15 | 597,000 | 33.56 | 40.56 |
International Game Technology | ( IGT | Quote | Chart | News | PowerRating) | 86 | 78.10 | +0.84 | 869,800 | 66.70 | 80.10 |
Stocks Forming a Handle
| color=#ffffff size=2>Company Name | color=#ffffff size=2>Symbol | color=#ffffff size=2>12 Month RS | color=#ffffff size=2>Price | color=#ffffff size=2>Price Change | color=#ffffff size=2>Average Volume | Pivot |
Expedia | ( EXPE | Quote | Chart | News | PowerRating) | 70 | 63.76 | -0.91 | 2,432,900 | 78.72 |
Apollo Group | ( APOL | Quote | Chart | News | PowerRating) | 82 | 41.25 | -1.01 | 2,258,700 | 46.57 |
Stocks Building A Base
color=#ffffff size=2>Company Name | color=#ffffff size=2>Symbol | color=#ffffff size=2>12 Month RS | color=#ffffff size=2>Price | color=#ffffff size=2>Price Change | color=#ffffff size=2>Average Volume | Pivot |
None |
href=”mailto:danielb@tradingmarkets.com”>danielb@tradingmarkets.com
If you are new to the “IT” strategy, be sure to
take a look at our
intermediate-term online trading course.
Intermediate-Term Traders
Report is posted on
Tuesdays and Fridays. For other intermediate-term commentary, be sure to read
Mark Boucher (Fridays),
Tim Truebenbach (Tuesdays and Thursdays), and
Gary Kaltbaum (Mondays and Thursdays).
