Monday’s Stock Watch
The major indexes lost
ground for the week, with the NYSE and Nasdaq posting a day of distribution
apiece. The weekly charts have set up bearish engulfing days on the
indexes, with the Dow and S&P closing below their 20-day moving averages, and
the Nasdaq right on this mark. Volume was slightly below average for the week.
Market breadth held relatively flat, with new
52-week highs showing a slight edge over the lows, though Mark Boucher‘s
Top
RS and ER List has shown a couple of days of bullish bias with 20+
readings. The
Bottom RS and ER List was nearly nonexistent.
Stocks on our watch list held their ground well
against an overall sliding market. Friday’s reversal day lacked the volume
needed to make it key, though the market’s ability to shake off negative
economic news weighs in on the bullish side of the scale.
The search continues for high-quality stocks meeting
or top fundamental and technical criteria.
From Friday’s action:
Market breadth was positive, with NYSE
advancing issues over declining issues by a ratio of 1.57, and up volume over
down volume by a 1.49 ratio. Nasdaq advancing issues over declining issues came
in at 1.15, and up volume beat down volume by a 1.88 ratio.
The Dow Jones Industrial Average
(
$INDU.X |
Quote |
Chart |
News |
PowerRating)
closed +0.26%
at 8,645.77. The S&P 500
(
$SPX.X |
Quote |
Chart |
News |
PowerRating)
closed +0.62% at
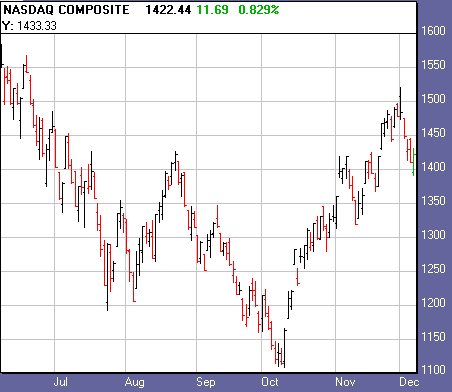
912.23. The Nasdaq
(
$COMPQ |
Quote |
Chart |
News |
PowerRating) closed
+0.82% at
1,422.38.

1,878
1,761
Declining Issues
1,180
1,530
691,015,000
984,984,000
497,659,000
529,310,000
Total
Volume
1,220,699,000
1,536,352,000
Highs
8
7
3
3
Top sectors:
Gold, Defense, Consumer, Leisure.
Watch List Action:
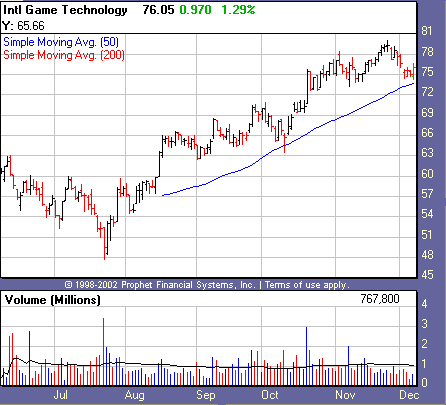
Notching in an accumulation day, International Gaming Technology
(
IGT |
Quote |
Chart |
News |
PowerRating) has
made a solid bounce above its 50-day moving average. The stock has suffered with
some distribution in recent sessions, though is showing signs of good health
above this key average.

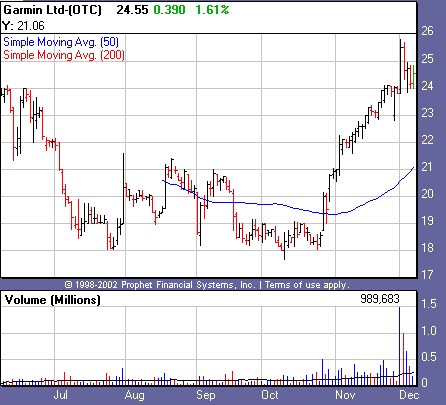
Our newest breakout, Garmin Ltd.
(
GRMN |
Quote |
Chart |
News |
PowerRating), pulled back this past week, with
decreasing volume giving us an indication that sellers may be bleeding out. The
stock is well above its major averages and has a strong base with nice
accumulation along its right side. The stock was also downgraded by Morgan
Stanley Thursday and has not been significantly affected.

Recent Breakouts
size=2>We monitor the action of Recent Breakouts as an indicator of
the market health for IT traders. When breakouts are acting well, this is a good
sign for the likelihood of further sustainable breakouts. When breakouts are
failing, IT traders should be even more cautious.
| color=#ffffff size=2>Company Name | color=#ffffff size=2>Symbol | color=#ffffff size=2>12 Month RS | color=#ffffff size=2>Price | color=#ffffff size=2>Price Change | color=#ffffff size=2>Average Volume | Pivot | 52-Week High |
Apollo Group | ( APOL | Quote | Chart | News | PowerRating) | 87 | 42.08 | +0.55 | 2,555,100 | 39.60 | 46.15 |
Coach Inc. | ( COH | Quote | Chart | News | PowerRating) | 94 | 33.91 | +0.88 | 936,500 | 29.80 | 35.70 |
Garmin Ltd. | ( GRMN | Quote | Chart | News | PowerRating) | 85 | 24.55 | +0.39 | 246,600 | 23.46 | 25.80 |
Hovnanian Enterprises | ( HOV | Quote | Chart | News | PowerRating) | 88 | 32.70 | +0.90 | 771,100 | 33.56 | 40.56 |
International Game Technology | ( IGT | Quote | Chart | News | PowerRating) | 87 | 76.05 | +0.97 | 1,099,000 | 75.47 | 80.10 |
Mentor Corp. | ( MNTR | Quote | Chart | News | PowerRating) | 93 | 40.48 | -2.35 | 255,900 | 41.50 | 45.45 |
We will be moving APOL to the “Building a Base”
list.
Stocks Forming a Handle
| color=#ffffff size=2>Company Name | color=#ffffff size=2>Symbol | color=#ffffff size=2>12 Month RS | color=#ffffff size=2>Price | color=#ffffff size=2>Price Change | color=#ffffff size=2>Average Volume | Pivot |
Commerce Bancorp. | ( CBH | Quote | Chart | News | PowerRating) | 62 | 44.06 | +0.26 | 723,500 | 47.90 |
Expedia | ( EXPE | Quote | Chart | News | PowerRating) | 94 | 70.21 | +0.10 | 2,854,400 | 78.72 |
Ross Stores Inc. | ( ROST | Quote | Chart | News | PowerRating) | 89 | 44.59 | -0.28 | 1,075,200 | 47.34 |
Stocks Building A Base
color=#ffffff size=2>Company Name | color=#ffffff size=2>Symbol | color=#ffffff size=2>12 Month RS | color=#ffffff size=2>Price | color=#ffffff size=2>Price Change | color=#ffffff size=2>Average Volume | Pivot |
None |
href=”mailto:danielb@tradingmarkets.com”>danielb@tradingmarkets.com
If you are new to the “IT” strategy, be sure to
take a look at our
intermediate-term online trading course.
Intermediate-Term Traders
Report is posted on
Tuesdays and Fridays. For other intermediate-term commentary, be sure to read
Mark Boucher (Fridays),
Tim Truebenbach (Tuesdays and Thursdays), and
Gary Kaltbaum (Mondays and Thursdays).
