Monday’s Stock Watch
As we head into the
holidays, the major indexes remain just a shade below their 50-day moving
averages. Volume for the week had the NYSE and Nasdaq each posting
two days of distribution, with one day of accumulation. The accumulation was
made on Friday, which was a quadruple witching day (counting the new single
stock futures), and may have contributed to a pickup in activity.
No doubt the markets have been softened with
distribution in recent weeks, though we’re bringing in a new year soon, and the
50-day moving averages will have to be watched closely for signs of direction
from institutional players. Current tensions with Iraq and Venezuela seemed to
have had a stranglehold on sentiment for the week, as business headlines
remained on the quiet side.
In the breadth department, it’s the same old story. New
52-week highs and lows are quiet, with neither list providing an edge. Mark Boucher‘s
Top
RS and ER List continues to produce numbers under the bullish indication of
20, and the
Bottom RS and ER List also giving us no bias, as its numbers remain below
20.
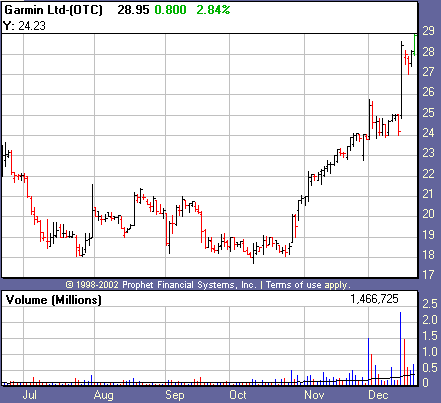
From our watch lists we had a couple of standouts
for the week. Garmin Ltd.
(
GRMN |
Quote |
Chart |
News |
PowerRating) and Apollo Group
(
APOL |
Quote |
Chart |
News |
PowerRating) are two
candidates that are showing clear promise. It will be encouraging from an
overall market perspective to see these breakouts succeed. Meanwhile, the search
for top stocks meeting our strict fundamental and technical criteria continues.
From Friday’s action:
Market breadth was positive, with NYSE
advancing issues over declining issues by a ratio of 1.97, and up volume over
down volume by a 3.10 ratio. Nasdaq advancing issues over declining issues came
in at 1.31, and up volume beat down volume by a 1.79 ratio.
Dow Jones Industrial Average
(
$INDU.X |
Quote |
Chart |
News |
PowerRating)
closed +1.75%
at 8,512.01. The S&P 500
(
$SPX.X |
Quote |
Chart |
News |
PowerRating)
closed +1.31% at
895.85.
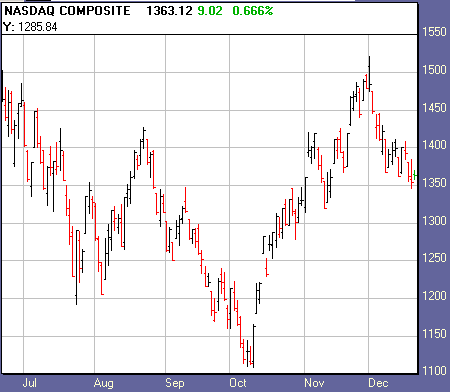
The Nasdaq
(
$COMPQ |
Quote |
Chart |
News |
PowerRating) closed +0.71% at
1,363.72.
NYSE
size=2>NASDAQ
Advancing Issues
2,012
1,869
Declining Issues
1,037
1,448
Advancing Volume
1,276,190,000
1,003,485,000
Declining Volume
438,362,000
742,493,000
Total
Volume
1,739,989,000
1,841,644,000
New 52-week
Highs
13
12
New 52-week Lows
14
11
Top sectors:
Gold, Defense, Consumer, Defensive.
Watch List Action:
Looking good, Garmin Ltd
(
GRMN |
Quote |
Chart |
News |
PowerRating) continues to make new highs as Friday
marked another day of accumulation. The market may be bad, but this stock is
proving itself a winner. Remember we don’t want to be chasing these more than 5%
past the pivot buy point. In this case you can consider the pivot to be at 25.90
(10 cents above the most recent consolidation.) Let’s hope we see more ones like
this in the near future.
Also defying recent market weakness, Apollo Group
(
APOL |
Quote |
Chart |
News |
PowerRating) staged another
breakout as Thursday it cruised past its pivot buy point of 44.46. This has been
one of the few success stories for the bear market. Accumulation made this week
is a good sign going forward, and we will likely see some type of pullback into
a cup-and-handle pattern as the stock encounters overhead resistance from its
most recent high.

Recent Breakouts
We monitor the action of Recent Breakouts as an indicator of
the market health for IT traders. When breakouts are acting well, this is a good
sign for the likelihood of further sustainable breakouts. When breakouts are
failing, IT traders should be even more cautious.
color=#ffffff size=2>Company Name | color=#ffffff size=2>Symbol | color=#ffffff size=2>12 Month RS | color=#ffffff size=2>Price | color=#ffffff size=2>Price Change | color=#ffffff size=2>Average Volume | Pivot | 52-Week High |
Coach Inc. | ( COH | Quote | Chart | News | PowerRating) | 92 | 33.40 | +1.25 | 901,600 | 29.80 | 35.70 |
Garmin Ltd. | ( GRMN | Quote | Chart | News | PowerRating) | 94 | 28.95 | +0.80 | 351,700 | 23.46 | 28.98 |
Hovnanian Enterprises | ( HOV | Quote | Chart | News | PowerRating) | 90 | 33.70 | -0.35 | 666,200 | 33.56 | 40.56 |
International Game Technology | ( IGT | Quote | Chart | News | PowerRating) | 83 | 74.30 | +2.41 | 998,100 | 66.70 | 80.10 |
Stocks Forming a Handle
color=#ffffff size=2>Company Name | color=#ffffff size=2>Symbol | color=#ffffff size=2>12 Month RS | color=#ffffff size=2>Price | color=#ffffff size=2>Price Change | color=#ffffff size=2>Average Volume | Pivot |
Expedia | ( EXPE | Quote | Chart | News | PowerRating) | 92 | 68.43 | +1.52 | 2,854,400 | 78.72 |
Ross Stores Inc. | ( ROST | Quote | Chart | News | PowerRating) | 87 | 43.52 | -0.54 | 1,075,200 | 47.34 |
Stocks Building A Base
color=#ffffff size=2>Company Name | color=#ffffff size=2>Symbol | color=#ffffff size=2>12 Month RS | color=#ffffff size=2>Price | color=#ffffff size=2>Price Change | color=#ffffff size=2>Average Volume | Pivot |
Apollo Group | ( APOL | Quote | Chart | News | PowerRating) | 90 | 45.25 | +0.75 | 2,494,900 | 44.46 |
If you are new to the “IT” strategy, be sure to
take a look at our
intermediate-term online trading course.
The next
Intermediate-Term Traders report will appear on Dec. 30, as I will be on
vacation next week.
For other intermediate-term commentary, be sure to read
Mark Boucher (Fridays),
Tim Truebenbach (Tuesdays and Thursdays), and
Gary Kaltbaum (Mondays and Thursdays).