Monday’s Stock Watch
The major averages put in
gains for a second week in a row, as NYSE volume accounted for one
day of accumulation, with one day of distribution, while the Nasdaq made two
days of accumulation. Friday’s negative employment numbers spooked stocks into a
lower open, though buyers stepped up and lifted the averages to gains on the
day. Shaking off bad news is a sign of a strong market, which is exactly what
the intermediate-term strategy needs.
Market internals for the week showed the New 52-week
highs maintaining a slight edge over the Lows list, though the numbers on both
lists are relatively low. Mark Boucher‘s
Top
RS and ER List perked up as it put in three days of readings over 20, while
the
Bottom RS and ER List remained nearly non-existent. The overall breadth
indication gives us a slight upside bias, though lacks the clear dominance we
would prefer.Â
Stocks on our watch list made mild progress north,
and from our “handles” list, APOL still looks primed for a breakout. We’ve seen
some decent looking base breakouts from top stocks in the market, which if they
succeed gives us encouragement to be new buyers. This report covers only those
candidates with exceptional technical and fundamental properties, as taught in
our
intermediate-term online trading course. Hopefully weekend research will
produce new names to post.
From Friday’s action:
Market breadth was positive, with NYSE
advancing issues over declining issues by a ratio of 1.06, and up volume over
down volume by a 1.36 ratio. Nasdaq advancing issues over declining issues came
in at 1.20, and up volume beat down volume by a 3.00 ratio.
Dow Jones Industrial Average
(
$INDU.X |
Quote |
Chart |
News |
PowerRating)
closed +0.09%
at 8,784.95. The S&P 500
(
$SPX.X |
Quote |
Chart |
News |
PowerRating)
closed unchanged at
927.57.
The Nasdaq
(
$COMPQ |
Quote |
Chart |
News |
PowerRating) closed
+0.64% at
1,447.75.

1,533
1,763
Declining Issues
1,552
1,486
777,101,000
1,194,925,000
655,491,000
436,477,000
Total
Volume
1,455,255,000
1,654,574,000
Highs
22
17
8
5
Top sectors:
Gold, Defense, Consumer, Defensive.
Watch List Action:
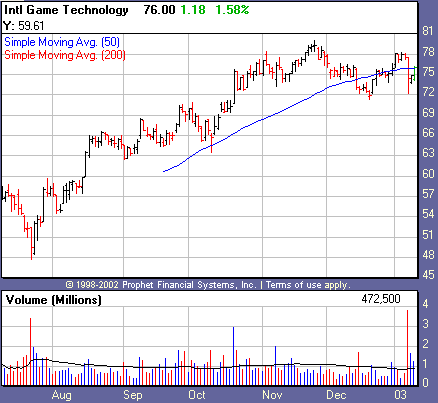
One of our strongest breakouts, International Gaming Tech
(
IGT |
Quote |
Chart |
News |
PowerRating), put in a
heavy day of distribution Wednesday, though has since recovered, and is
attempting to regain its 50-day moving average. The stock has put in two major
days of distribution in the last month vs. two days of accumulation. It’s not
time to pull the sell trigger just yet, though keep a tight watch.

From our “handles” list, Apollo Group
(
APOL |
Quote |
Chart |
News |
PowerRating) had a strong finish Friday as
it was under accumulation. The technical pattern on this one looks good, and
with a strong overall market we might get our breakout. For a good read on the
ideal setup be sure to read our
lesson on handles.

Recent Breakouts
size=2>We monitor the action of Recent Breakouts as an indicator of
the market health for IT traders. When breakouts are acting well, this is a good
sign for the likelihood of further sustainable breakouts. When breakouts are
failing, IT traders should be even more cautious.
| color=#ffffff size=2>Company Name | color=#ffffff size=2>Symbol | color=#ffffff size=2>12 Month RS | color=#ffffff size=2>Price | color=#ffffff size=2>Price Change | color=#ffffff size=2>Average Volume | Pivot | 52-Week High |
Coach Inc. | ( COH | Quote | Chart | News | PowerRating) | 92 | 33.40 | +0.02 | 872,300 | 28.35 | 35.70 |
Garmin Ltd. | ( GRMN | Quote | Chart | News | PowerRating) | 95 | 31.48 | +0.48 | 404,400 | 23.46 | 31.35 |
Hovnanian Enterprises | ( HOV | Quote | Chart | News | PowerRating) | 81 | 33.46 | +0.02 | 597,000 | 33.56 | 40.56 |
International Game Technology | ( IGT | Quote | Chart | News | PowerRating) | 82 | 76.00 | +1.18 | 869,800 | 66.70 | 80.10 |
Stocks Forming a Handle
| color=#ffffff size=2>Company Name | color=#ffffff size=2>Symbol | color=#ffffff size=2>12 Month RS | color=#ffffff size=2>Price | color=#ffffff size=2>Price Change | color=#ffffff size=2>Average Volume | Pivot |
Expedia | ( EXPE | Quote | Chart | News | PowerRating) | 90 | 66.42 | -0.69 | 2,432,900 | 78.72 |
Apollo Group | ( APOL | Quote | Chart | News | PowerRating) | 80 | 44.47 | +0.57 | 2,258,700 | 46.57 |
Stocks Building A Base
color=#ffffff size=2>Company Name | color=#ffffff size=2>Symbol | color=#ffffff size=2>12 Month RS | color=#ffffff size=2>Price | color=#ffffff size=2>Price Change | color=#ffffff size=2>Average Volume | Pivot |
None | Â | Â | Â | Â | Â | Â |
href=”mailto:danielb@tradingmarkets.com”>danielb@tradingmarkets.com
If you are new to the “IT” strategy, be sure to
take a look at our
intermediate-term online trading course.
Intermediate-Term Traders
Report is posted on
Tuesdays and Fridays. For other intermediate-term commentary, be sure to read
Mark Boucher (Fridays),
Tim Truebenbach (Tuesdays and Thursdays), and
Gary Kaltbaum (Mondays and Thursdays).
