Monday’s Stock Watch
Daniel Beighley is on vacation until
Monday, Sept. 30.
For intermediate-term commentary,
please read
Mark Boucher (Fridays),
Tim Truebenbach (Tuesdays and Thursdays), and
Gary Kaltbaum (Mondays and Thursdays).
The markets lost ground for the fourth week in a
row. For the past three weeks, the NYSE has posted four days of accumulation and
three days of distribution, while the Nasdaq has made four days of accumulation
and four days of distribution.
New 52-week lows continue to dominate the highs in
numbers, and Mark Boucher‘s
Top
RS and ER List and
Bottom RS and ER List remain biased to the bears.
This market remains an unfriendly
environment for the intermediate-term trader, though recent breakouts are
showing some promise. Trading the long side should not be considered until we
see the breakouts succeeding with substantial gains under signs accumulation.
This report is best used as a measure of bullishness in the market until signs
of a durable bottom are evident.
Stocks on our watch list put in
mixed performances for the week. The search continues for high-quality stocks
meeting our high technical and fundamental requirements.
From Friday’s action:
Market breadth was positive, with NYSE
advancing issues over declining issues by a ratio of 1.10, and up volume over
down volume by a 1.25 ratio. Nasdaq advancing issues over declining issues came
in at 1.06, and up volume beat down volume by a 1.28 ratio.
The Dow Jones Industrial Average
(
$INDU.X |
Quote |
Chart |
News |
PowerRating) closed +0.54% at
7986.02. The S&P 500
(
$SPX.X |
Quote |
Chart |
News |
PowerRating)
closed +0.24% at 845.39.
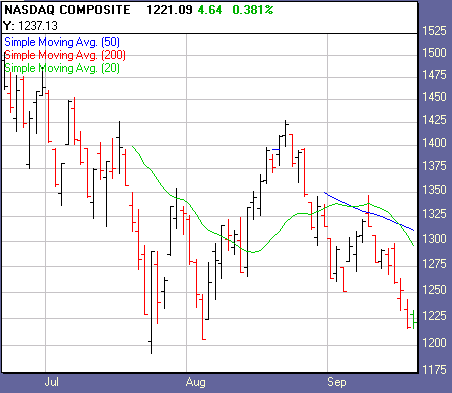
The Nasdaq
(
$COMPQ |
Quote |
Chart |
News |
PowerRating) closed +0.38% at 1221.08.
1,600
1,713
Declining Issues
1,413
1,605
930,810,000
1,012,990,000
752,394,000
756,372,000
Total
Volume
1,739,155,000
1,787,831,000
Highs
2
6
55
39
Top sectors:
Telecoms
(
$IXTC |
Quote |
Chart |
News |
PowerRating), +3.21%, forest and paper
[
(
$FPP |
Quote |
Chart |
News |
PowerRating), +2.92%, and chemicals
(
$CEX |
Quote |
Chart |
News |
PowerRating), +1.86%.
Losing sectors:
Oil services
(
$OSX |
Quote |
Chart |
News |
PowerRating), -1.91%,
utilities
(
$UTIL |
Quote |
Chart |
News |
PowerRating), -1.49%, and semiconductors
(
$SOX |
Quote |
Chart |
News |
PowerRating), -1.42%.
Watch List Action:
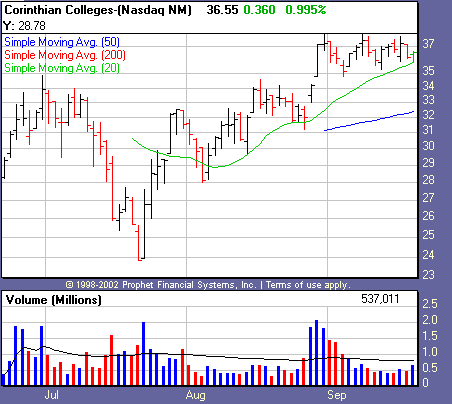
Still on the bullish track, recent breakout Corinthian Colleges
(
COCO |
Quote |
Chart |
News |
PowerRating)
appears to be forming an ascending triangle. The stock has made three days of
accumulation in the past two weeks, with no distribution.
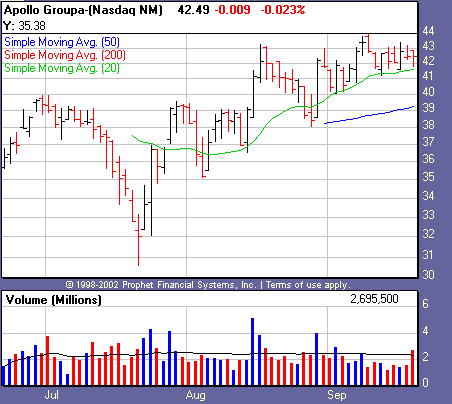
Posting distribution Friday, recent breakout Apollo Group
(
APOL |
Quote |
Chart |
News |
PowerRating) is showing
signs of weakness. With no accumulation in the last two weeks, we are now
watching to see how the stock manages above its major moving averages.
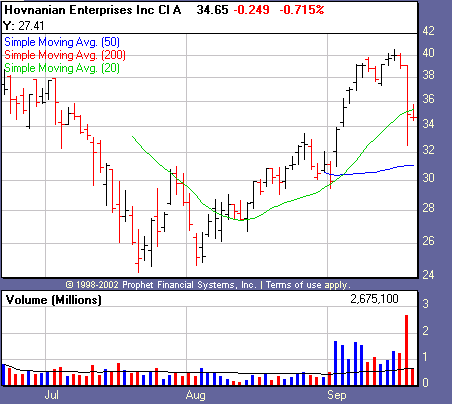
Posting heavy distribution Thursday, recent breakout Hovnanian Enterprises
(
HOV |
Quote |
Chart |
News |
PowerRating)
has nearly erased the gains made since its breakout. The heavy accumulation made at
the breakout is belittled by the selling, and it is now threatening to trade back
into its base.
Recent Breakouts
size=2>We monitor the action of Recent Breakouts as an indicator of
the market health for IT traders. When breakouts are acting well, this is a good
sign for the likelihood of further sustainable breakouts. When breakouts are
failing, IT traders should be even more cautious.
| color=#ffffff size=2>Company Name | color=#ffffff size=2>Symbol | color=#ffffff size=2>12 Month RS | color=#ffffff size=2>Price | color=#ffffff size=2>Price Change | color=#ffffff size=2>Average Volume | Pivot | 52-Week High |
Apollo Group | ( APOL | Quote | Chart | News | PowerRating) | 94 | 42.49 | -0.01 | 2,361,500 | 39.60 | 44.00 |
Alliant Techsystems | ( ATK | Quote | Chart | News | PowerRating) | 87 | 70.93 | +0.93 | 471,900 | 69.95 | 76.93 |
Coach Inc. | ( COH | Quote | Chart | News | PowerRating) | 95 | 28.14 | -0.39 | 1,080,100 | 28.35 | 30.12 |
Corinthian Colleges | ( COCO | Quote | Chart | News | PowerRating) | 97 | 36.55 | +0.36 | 808,100 | 34.69 | 38.00 |
Hovnanian Enterprises | ( HOV | Quote | Chart | News | PowerRating) | 98 | 34.65 | -0.25 | 656,600 | 33.56 | 40.56 |
International Game Technology | ( IGT | Quote | Chart | News | PowerRating) | 87 | 66.29 | +1.79 | 938,300 | 66.70 | 68.50 |
Penn National Gaming
(
PENN |
Quote |
Chart |
News |
PowerRating) has sold off
more than 7% from its pivot buy point and is now off the list.
Stocks Forming a Handle
| color=#ffffff size=2>Company Name | color=#ffffff size=2>Symbol | color=#ffffff size=2>12 Month RS | color=#ffffff size=2>Price | color=#ffffff size=2>Price Change | color=#ffffff size=2>Average Volume | Pivot |
Bed Bath & Beyond | ( BBBY | Quote | Chart | News | PowerRating) | 82 | 33.94 | +0.09 | 4,593,100 | 35.85 |
Education Mgt. Co. | ( EDMC | Quote | Chart | News | PowerRating) | 85 | 42.24 | +0.77 | 333,200 | 43.19 |
Kohl’s Corporation | ( KSS | Quote | Chart | News | PowerRating) | 79 | 69.55 | +0.93 | 2,643,400 | 73.16 |
Mid Atlantic Medical Services | ( MME | Quote | Chart | News | PowerRating) | 94 | 35.70 | +0.34 | 536,600 | 38.18 |
Annaly Mgt. Inc.
(
NLY |
Quote |
Chart |
News |
PowerRating) has sold off below its
50-day moving average on heavy volume and has been removed from the list.
Commerce Bancorp.
(
CBH |
Quote |
Chart |
News |
PowerRating) has sold off below
its major moving averages on heavy volume and has been removed from the list.
Hilb Rogal Hamilton
(
HRH |
Quote |
Chart |
News |
PowerRating) has sold off below
its 50-day moving average on heavy volume and has been removed from the list.
Stocks Building A Base
color=#ffffff size=2>Company Name | color=#ffffff size=2>Symbol | color=#ffffff size=2>12 Month RS | color=#ffffff size=2>Price | color=#ffffff size=2>Price Change | color=#ffffff size=2>Average Volume |
Brown & Brown | ( BRO | Quote | Chart | News | PowerRating) | 54 | 26.56 | -0.69 | 324,500 |
Wellpoint Health Network | ( WLP | Quote | Chart | News | PowerRating) | 88 | 74.90 | -0.16 | 1,648,900 |
href=”mailto:danielb@tradingmarkets.com”>danielb@tradingmarkets.com
If you are new to the “IT” strategy, be sure to
take a look at our
intermediate-term online trading course.
For other intermediate-term commentary, be sure to read
Mark Boucher (Fridays),
Tim Truebenbach (Tuesdays and Thursdays), and
Gary Kaltbaum (Mondays and Thursdays).