Monday’s Stock Watch
The Dow and S&P 500 have
been able to rally for four days in a row now. With a certified
follow-through day put in July 29, things are looking positive. This past week,
the NYSE was able to make two accumulation days, while the Nasdaq made one.
What’s missing is heavy volume and breadth. New 52-week lows continue to
dominate the highs, and
Mark Boucher‘s
Bottom RS and ER List continues to outshine his
Top
RS and ER List.
Conditions are a far cry from allowing us to believe
it’s buying time. With numerous uncertainties over our economy and world events,
our markets remain ever-vulnerable to ever-changing circumstances. We
continue to search for stocks meeting our strict fundamental and technical
criteria, though seldom come up with qualified candidates. This alone is an
indication of weakness for the overall market. When we do find qualified stocks
setting up in bases, there is still the difficult environment of a bear market.
It’s been a no-go to the long side in this market, though patience and
discipline are keeping us out of trouble.
From Tuesday’s action:
Market breadth was mixed, with NYSE
advancing issues over declining issues by a ratio of 1.98, and up volume over
down volume by a 1.48 ratio. Though, Nasdaq declining issues over advancing issues came in
at 1.33, and down volume beat up volume by a 2.30 ratio.
The Dow Jones Industrial Average
(
$INDU.X |
Quote |
Chart |
News |
PowerRating) closed up 0.382% at 8745.18. The S&P 500
(
$SPX.X |
Quote |
Chart |
News |
PowerRating)
closed up 0.34% at 908.60 at.
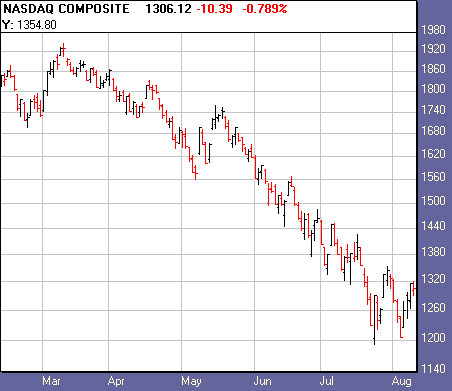
The Nasdaq
(
$COMPQ |
Quote |
Chart |
News |
PowerRating) closed down 0.79% at 1306.05.

1,708
1,382
Declining Issues
1,379
1,842
897,873,090
393,556,384
569,201,090
900,939,424
Total
Volume
1,483,910,700
1,314,119,129
Highs
33
20
64
128
Top sectors:
Gold and Silver Index
(
$XAU.X |
Quote |
Chart |
News |
PowerRating), up 7.17% at 66.13.
Oil Service Sector Index
(
$OSX.X |
Quote |
Chart |
News |
PowerRating), up 3.98% at 79.25.
Losing sectors:
GSTI Hardware Index
(
$GHA.X |
Quote |
Chart |
News |
PowerRating),
down 4.52% at 153.46.
Morgan Stanley Healthcare Provider Index
(
$RXH.X |
Quote |
Chart |
News |
PowerRating), down 3.33% at 328.49.
Sectors with Most New 52-Week Highs (10 or more):
None
Watch List Action:
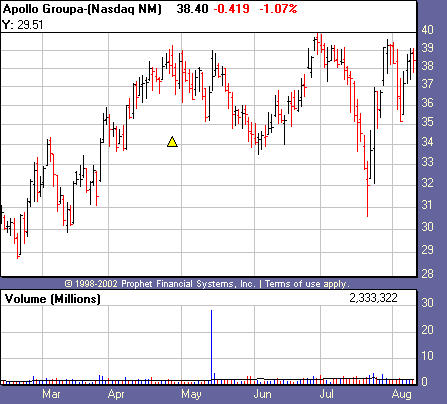
Today Apollo Group
(
APOL |
Quote |
Chart |
News |
PowerRating) fell 1.02% on below-average volume
as it forms what could be an ugly handle or ascending triangle.
The stock has been somewhat cool while the overall markets steam ahead, though
has only put in one distribution day compared to three accumulation days in the
past three weeks. If this one breaks out, no bets are on that it will run. This is
still a certified bear market.

Recent Breakouts
size=2>We monitor the action of Recent Breakouts as an indicator of
the market health for IT traders. When breakouts are acting well, this is a good
sign for the likelihood of further sustainable breakouts. When breakouts are
failing, IT traders should be even more cautious.
| color=#ffffff size=2>Company Name | color=#ffffff size=2>Symbol | color=#ffffff size=2>12 Month RS | color=#ffffff size=2>Price | color=#ffffff size=2>Price Change | color=#ffffff size=2>Average Volume | Pivot | 52-Week High |
None |
Stocks Forming a Handle
| color=#ffffff size=2>Company Name | color=#ffffff size=2>Symbol | color=#ffffff size=2>12 Month RS | color=#ffffff size=2>Price | color=#ffffff size=2>Price Change | color=#ffffff size=2>Average Volume | Pivot |
None |
Stocks Building A Base
color=#ffffff size=2>Company Name | color=#ffffff size=2>Symbol | color=#ffffff size=2>12 Month RS | color=#ffffff size=2>Price | color=#ffffff size=2>Price Change | color=#ffffff size=2>Average Volume |
Apollo Group | ( APOL | Quote | Chart | News | PowerRating) | 92 | 38.40 | – 0.42 | 2,223,300 |
href=”mailto:danielb@tradingmarkets.com”>danielb@tradingmarkets.com
If you are new to the “IT” strategy, be sure to
take a look at our
intermediate-term online trading course.
Intermediate-Term Traders Report is posted on
Tuesdays and Fridays. For other intermediate-term commentary, be sure to read
Mark Boucher (Fridays),
Tim Truebenbach (Tuesdays and Thursdays), and
Gary Kaltbaum (Mondays and Thursdays).
