Monday’s Stock Watch
The major indexes ended
mixed today, with above average volume on the NYSE marking
distribution, and average volume on the Nasdaq qualifying for accumulation.
Biotechnology, gold and silver, broker/dealers, insurance, and banks were some
of the biggest gainers; while airlines, telecoms, and Internet issues were the
biggest losers. Once again, there were no standout groups in a nearly
nonexistent 52-week highs list, with telecoms, drugs, and electronics making up
the highest concentrations of 52-week lows. There was only one gainer from our
watch list.
Market breadth was mixed, with NYSE
declining issues over advancing issues by a ratio of 1.19, and down volume over
up volume by a 1.62 ratio. Nasdaq advancing issues over declining issues came
in at 1.00, and up volume beat down volume by a 1.06 ratio.
The Dow Jones Industrial Average
(
$INDU |
Quote |
Chart |
News |
PowerRating) closed down 0.30% at 9474.21. The S&P 500
(
$SPX |
Quote |
Chart |
News |
PowerRating)
closed down 0.22% at 1007.26.
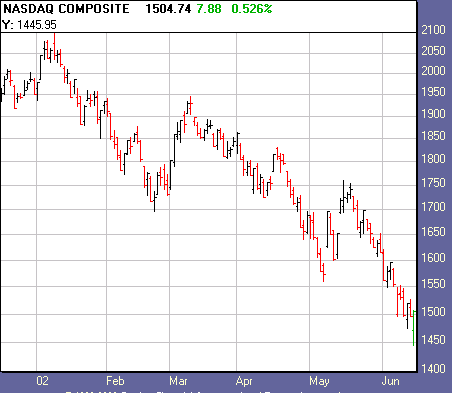
The Nasdaq
(
$COMPQ |
Quote |
Chart |
News |
PowerRating) closed up 0.51%
at 1504.64.
Â
1,450
1,715
Issues
1,728
1,714
576,000,000
920,000,000
947,000,000
879,000,000
Total
Volume
1,550,046,000
1,824,667,000
Highs
9
7
30
17
Weekly Perspective:
Another week, another loss for the
markets, as the Dow shed 115.46 points for a 1.20% decline, the S&P 500 fell
20.26 points for a 1.97% loss, and the Nasdaq dropped 30.74 points for a 2%
fall. For the past three weeks, the NYSE has qualified for two accumulation days
and eight distribution days, while the Nasdaq has made four accumulation days
with five distribution days.
This past week was marked by scandal,
terror, more downgrades, disappointing economic news, and price action that saw
the S&P 500 and Nasdaq come close to its September lows. Market breadth remained
negative, as the new 52-week lows list took dominance over the highs. Outside of
capitulation, many Wall Street veterans believe sentiment doesn’t get a whole
lot worse.
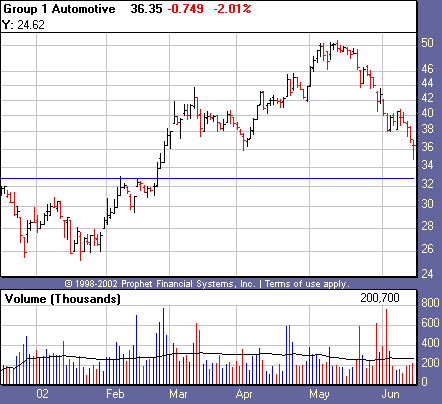
The four remaining stocks on our watch
list held their places on the breakout list, though Group 1 Automotive
(
GPI |
Quote |
Chart |
News |
PowerRating)
suffered significantly.
Top sectors:
Biotechnology Index
(
$BTK.X |
Quote |
Chart |
News |
PowerRating), up 4.23% at
35.48.
Gold and Silver Index
(
$XAU.X |
Quote |
Chart |
News |
PowerRating),
up 3.92% at 76.99.
Losing sectors:
Airline Index
(
$XAL.X |
Quote |
Chart |
News |
PowerRating), down 4.73% at
72.01.
North American Telecoms Index
(
$XTC.X |
Quote |
Chart |
News |
PowerRating), down
3.33% at
449.72.
Sectors with Most New 52-Week Highs (10 or more):
None
Watch List Action:
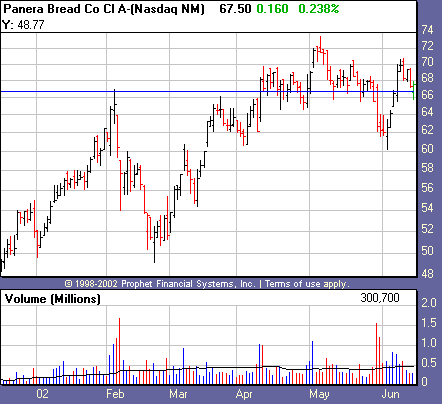
Panera Bread Company
(
PNRA |
Quote |
Chart |
News |
PowerRating) rose 0.23% on below average volume. The
stock was below its most recent pivot point at its low today.
Group 1 Automotive
(
GPI |
Quote |
Chart |
News |
PowerRating) fell 2.01% on below average volume. The stock has
put in six distribution days and zero accumulation days for the past three
weeks.
Recent Breakouts
size=2>We monitor the action of Recent Breakouts as an indicator of
the market health for IT traders. When breakouts are acting well, this is a good
sign for the likelihood of further sustainable breakouts. When breakouts are
failing, IT traders should be even more cautious.
Chicos FAS Inc.
(
CHS |
Quote |
Chart |
News |
PowerRating), down 1.03% on
average volume for a distribution day.
Christopher & Banks Corporation
(
CHBS |
Quote |
Chart |
News |
PowerRating), down
1.60% on below average volume.
Group 1 Automotive
(
GPI |
Quote |
Chart |
News |
PowerRating), down 2.02% on
below-average volume.
size=2>Panera Bread Co
(
PNRA |
Quote |
Chart |
News |
PowerRating), up 0.23%
on below-average volume.
| color=#ffffff size=2>Company Name | color=#ffffff size=2>Symbol | color=#ffffff size=2>12 Month RS | color=#ffffff size=2>Price | color=#ffffff size=2>Price Change | color=#ffffff size=2>Average Volume | Pivot | 52-Week High |
| Chicos FAS Inc. | ( CHS | Quote | Chart | News | PowerRating) | 92 | 39.18 | – 0.41 | 697,900 | 38.08 | 42 |
Christopher & Banks | ( CHBS | Quote | Chart | News | PowerRating) | 95 | 41.01 | – 0.63 | 390,300 | 33.60 | 42.45 |
Group 1 Automotive | ( GPI | Quote | Chart | News | PowerRating) | 72 | 36.35 | – 0.75 | 266,900 | 33.14 | 50.08 |
size=2>Panera Bread Co | size=2> ( PNRA | Quote | Chart | News | PowerRating) | 93 | 67.50 | + 0.16 | 481,600 | 66.23 | 73.60 |
Stocks Forming a Handle
| color=#ffffff size=2>Company Name | color=#ffffff size=2>Symbol | color=#ffffff size=2>12 Month RS | color=#ffffff size=2>Price | color=#ffffff size=2>Price Change | color=#ffffff size=2>Average Volume | Pivot |
None | Â | Â | Â | Â | Â | Â |
Stocks Building A Base
color=#ffffff size=2>Company Name | color=#ffffff size=2>Symbol | color=#ffffff size=2>12 Month RS | color=#ffffff size=2>Price | color=#ffffff size=2>Price Change | color=#ffffff size=2>Average Volume |
None | Â | Â | Â | Â | Â |
href=”mailto:danielb@tradingmarkets.com”>danielb@tradingmarkets.com
If you are new to the “IT” strategy, be sure to
take a look at our
intermediate-term online trading course.