Month-End Week
We said
that Thursday’s rally was no Generals’ rally and
that the bias was up Friday going into the long weekend. Well, the bias was not
to be, as all three major indexes shed more than 1% each. The S&P 500
(
SPX |
Quote |
Chart |
News |
PowerRating)
declined 1.2%, Nasdaq 100
(
NDX |
Quote |
Chart |
News |
PowerRating) 2.1% and the Dow -1.1%. The
decline was on lighter volume for the third straight day. Total volume was 828
million, volume ratio of 32 and there were 248 decliners over advancers with
institutional blocks just slightly over 14,000.Â
I see that my pet peeve,
the Bureau of Labor Falsehoods, revised that 2% GDP number originally reported,
down to 1.3%. What a surprise. Home sales are reported declining and I believe
that one because housing stocks like
(
LEN |
Quote |
Chart |
News |
PowerRating) and
(
PHM |
Quote |
Chart |
News |
PowerRating) have declined just
over 20% each during the past 15 days. The
inflation team jumped all over the 2% GDP number and now the recession team will
be all over the broad drop in durable goods number and home sales decline.
As traders, you should be all over what
the stocks actually do. Forget the rest.Â
This rally has obviously
discounted the jump-start that interest rate cuts and, more importantly, the
growth in money supply, is going to influence future earnings as the economy
recovers. The problem is there is
going to be lots of negative-earnings news and warnings over the near term that
can shake the tree. As I said, the Generals don’t have to sell, just walk away
and watch the show — as that will be enough to create airpockets in many
extended stocks.
The Nasdaq 100
(
NDX |
Quote |
Chart |
News |
PowerRating)
has already re-entered its trading range below the upper 1982 boundary, closing
at 1960.74 on Friday. You are now looking at 1982 as an upside inflection point
before you get to the 2074 high last Wednesday, which is just right at the .50
retracement to the 2772 high, the 100-day EMA of 2060 and just below the 2087
resistance we have mentioned in previous commentary.
The S&P 500
(
SPX |
Quote |
Chart |
News |
PowerRating)
closed at 1277.89, just above the recent trading-range top at 1272-1274. The
20-day EMA is 1271 and the 100-day EMA is 1263. The 1200 level remains a magnet
with at least three different invitations for the index to retrace further. From
the breakout of the trading range at the 1273 level up to the expected
resistance at the 1304-1307 zone, there has been a negative divergence in RSI,
so that was a definite red flag to expect the 1305-1307 resistance to come into
play, which it certainly did. On
the weekly chart, the RSI is in an uptrend, closing at 55 on Friday. The
30-week EMA is 1279.82.
Stocks
Today
|
(June
|
||
|
Fair Value
|
Buy
|
Sell
|
|
2.20
|
 3.50  |
 0.95 Â
|
Remember, we move when the
Generals move. For example, last Wednesday, many of the big tradable Biotechs
gave us wide-range reversal bars, closing in the bottom of their ranges. These
stocks are all up 100%+ during this rally.
The next day, we were ready
for intraday shorts but they really didn’t give us any daylight. On Thursday and
Friday, they closed near the top of their ranges so today we must be ready if
they try to take them higher going
into the end of the month.Â
Biotechs to focus on:
(
PDLI |
Quote |
Chart |
News |
PowerRating),
(
IDPH |
Quote |
Chart |
News |
PowerRating) and
(
GENZ |
Quote |
Chart |
News |
PowerRating) (which is locked in a narrow range 3 pattern inside
of a large symmetrical triangle, so you can play it either way).Â
Other stocks on the long
side:
(
BBBY |
Quote |
Chart |
News |
PowerRating),
(
COST |
Quote |
Chart |
News |
PowerRating),
(
BHI |
Quote |
Chart |
News |
PowerRating),
(
VAR |
Quote |
Chart |
News |
PowerRating),
(
COF |
Quote |
Chart |
News |
PowerRating),
(
PVN |
Quote |
Chart |
News |
PowerRating),
(
FLEX |
Quote |
Chart |
News |
PowerRating),
(
BAX |
Quote |
Chart |
News |
PowerRating),
(
AHP |
Quote |
Chart |
News |
PowerRating),
(
SGP |
Quote |
Chart |
News |
PowerRating), and
(
NVDA |
Quote |
Chart |
News |
PowerRating) (which you can play long or
short from its inside-day pattern) and also
(
IRF |
Quote |
Chart |
News |
PowerRating) which is in the same
pattern.
On the short side, with
today coming into the end of the month and also after the long weekend, I’d stay
involved with the QQQs and SPYs — it’s easier to read the market today with the
programs and lack of activity.
Have a good trading day.

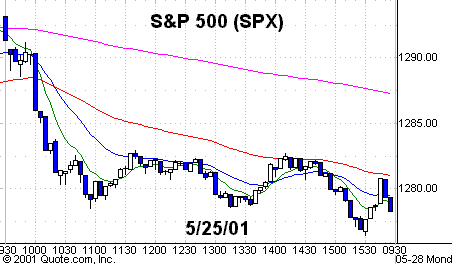
Five-minute chart of Friday’s S&P 500 (SPX) with 8-,
20-, 60-
and 260-EMAs

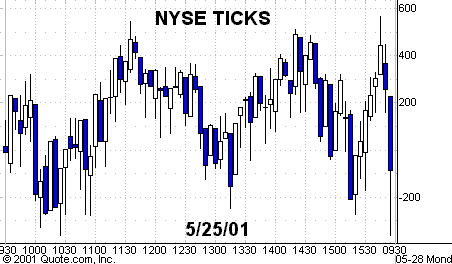
Five-minute chart of Friday’s NYSE Ticks
