More Moon
It looks
like the Full Moon day was exactly
that — a specific mission. The 2409-2531 rally in the Nasdaq 100
(
NDX |
Quote |
Chart |
News |
PowerRating) was
5% and was halted at a geometric retracement point relative to the 2627 high on
Feb. 1 (see your five-minute charts). This was a good pop from the .50
retracement zone on the daily chart. It declined to 2349 or the .618 level on
Wednesday, then rallied into that close, then carried over yesterday morning to
a 2464 high. That was a 4.9% rally and stopped on the number — framed from
2531-2350. The decline from the
10:30 a.m. bar took the index down to a 2356 close.Â
The sell side game plan for
the NDX today is as follows:
-
Continuation short
below yesterday’s low of 2350. The decision is to cover and go long if it
reverses the low and/or play again on the short side if the NDX breaks 2350
on second entry — and that’s assuming we get a contra rally if the retail
have to sell at the market makers’ discount on the opening. My next alert
levels are the extension legs at 2319, 2280 and then the .786 level of 2234.
Percentage-wise, it is only -1.5%, -3.2% and -5%. -
You then calculate
your Volatility Bands, using 52.07 as the combined Implied Volatility. You
get the 1.28 band at 2274, the 1.5 at 2259 and the 2.0 at 2227. You now have
an idea of the convergence between the 2280 extension leg and the 1.28 band,
in addition to the .786 level at 2234 and the 2.0 band of 2227. -
Having done this, you
can now focus on the market dynamics in those stocks you are trading. These
are alert zones where you look for a Change of Direction pattern to develop,
such as the lay up on Wednesday. -
When you get a
reversal pattern in the index, you will get entry patterns in various
stocks, so keep scrolling. In the S&P 500
(
SPX |
Quote |
Chart |
News |
PowerRating), the first two
extension legs are 1.27 at 1330 and 1.618 at 1324, while the 2.0 extension
leg is 1318, which converges with the .50 retracement on your daily chart,
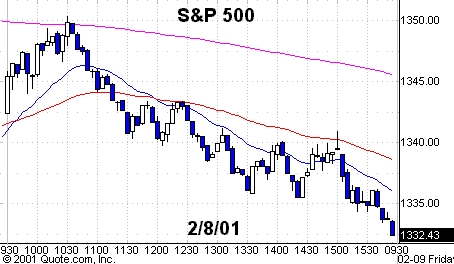
which is also 1318. The SPX closed at 1332.53, with a low of 1332. The
volatility bands are 1.28 at 1316, 1.5 at 1313 and 2.0 at 1306.The .618
retracement of the recent rally is 1303 on your daily chart. The combined
Implied Volatility you use is 18.85 which is on the low end.
Yesterday’s low in the Nasdaq 100
(
NDX |
Quote |
Chart |
News |
PowerRating) is a sitting duck for the program traders to leg a trade today and the
futures players to toy with. Translated,
it means that if an institution wants to sell the futures at 15 points (just to
pick a number) and buy the NDX 100 stocks, a program trader might stop the
institution at that spread and then he can work as agent, principal, or both, to
execute the program. If he does better than 15 points, he will usually get part
of the overage.
If we stay red early today,
the program trader looks at the 2350 low and says it is a good inflection point
which will bring in selling and set off stop orders if broken. What he can do —
and he is at risk — is to start the snowball rolling by leaning on the futures,
which forces the break and brings in more sellers as the NDX stocks
decline.Â
His bet is if he legs the
sale of futures and stocks decline, breaking the lows, he will be able to buy
the stocks lower. So, maybe he has done the trade at, say, 16.5 point spread,
which is more vig for him and the customer. If he legs the futures and is wrong,
he knows the worst case is that he can buy the trade from the customer at a 15
point spread. This is the reason you see so many Full Moon trades — it is an
absolute license.Â
Today is just an example of
a downside market game plan that you start the day with, but you must also go
through the S&P 500 and NDX 100 screens looking for daily chart setups so
you are prepared for whatever the market gives us today. Not
enough time here to do the upside, but you get the drift.
|
(March
|
||
|
Fair Value
|
Buy
|
Sell
|
|
6.40
|
7.70Â |
 5.10Â
|
Stocks today: Really not
focused on them — only focusing on the
(
QQQ |
Quote |
Chart |
News |
PowerRating)s and the SPDRs — and if they
go south on the Semis (which have retraced a half to two-thirds of their recent
rallies and they acted well early yesterday).
Have a good trading day.