My Game Plan For Monday
What Friday’s Action Tells
You
Friday’s gap on announced news, with the SPX
(
$SPX.X |
Quote |
Chart |
News |
PowerRating) closing at 1144.80, +0.9% and 3.0% for the week, puts the
SPX at
+5.3% in seven days into the end of the quarter and first two trading days
in
April. The 1087.06 low was made on 03/24/04, with the 4 MA of the volume
ratio
at 29 and breadth -760. Friday ended with the volume ratio at 69 and the 4 MA at
67,
with breadth at just +179 on Friday and the 4 MA +774. The 4 MAs on Thursday
were
71 and +1114.
The SPX percentage move was well below our
focus
longs,
(
QQQ |
Quote |
Chart |
News |
PowerRating) and
(
SMH |
Quote |
Chart |
News |
PowerRating), that have retraced to their rising 200-day
EMAs
and other confluence. If you missed that buy opportunity because the stock
ghost
got your emotions, then move on because there will be more opportunities,
but not
right into this 7-9 day rally depending on what index, etc., you
were
looking at.
The SMH is +12.6% in nine days off its 36.85
low
to Friday’s 41.50 high and +9.2% on the re-cross of the 200-day EMA. The
QQQs
are +9.3% to Friday’s 37.16 high for the same period. The Russell 2000
(
IWM |
Quote |
Chart |
News |
PowerRating) hit 120.94 on Friday, +9.2% in seven days, closing at a new market
high of 120.40. (You have this chart from a commentary last week.) The
Nasdaq
(
$COMPQ |
Quote |
Chart |
News |
PowerRating) was +8.4% and then came the basics, which put in the next
best
performance to the SMHs, with the XLB +11.7%.
NYSE volume expanded to 1.6 billion Friday,
while
the QQQ volume of 146 million is the most this year and also since 07/24/02.
The
jobs report also resulted in a dollar rally with interest rates climbing,
much
to the delight of this corner, as the
(
TLT |
Quote |
Chart |
News |
PowerRating) was -2.8% at 86.41 by 12:40
p.m.
ET, and 86.75 by 10:30 a.m. after a gap down opening to 87.16 from 88.91.
The
trade was 70% closed out by this corner and playing with the remaining
30%.
The dialogue on the economy by the media and
politicians is so far off reality from the actual numbers, and timing of
them,
but if you actually view some of the pertinent charts, you can get a much
better
picture of what is actually going on and how it preceded the 2000 top and
2002
bottom. Politics and the business cycle facts are not one and the same. I
will
highlight some of these in Tuesday’s text, and you will see why I have felt
so
strongly about selling into the hyped strength in the TLTs.
| Â | Monday 3/29 |
Tuesday 3/30 |
Wed. 3/31 |
Thurs. 4/1 |
Fri. 4/2 |
Net |
Index |
 |  |  |  |  |  |
| SPX |
 |  |  |  |  |  |
High |
1124.37 | 1127.60 | 1130.83 | 1135.67 | 1144.81 | 1144.81 |
Low |
1108.06 | 1119.66 | 1121.46 | 1126.20 | 1132.17 | 1108.06 |
Close |
1122.47 | 1127.00 | 1126.21 | 1132.17 | 1141.80 | 1141.80 |
% |
+1.3 | +0.4 | -.07 | +0.5 | +0.9 | +3.0 |
Range |
16.3 | 7.9 | 9.4 | 9.5 | 12.6 | 36.8 |
% Range |
88 | 93 | 50 | 63 | 76 | 92 |
INDU |
10330 | 10382 | 10358 | 10373 | 10471 | Â |
% |
+1.1 | +0.5 | -0.2 | +0.2 | +0.9 | +2.5 |
Nasdaq |
1993 | 2001 | 1994 | 2015 | 2057 | Â |
% |
+1.7 | +0.4 | -0.3 | +1.0 | +2.1 | +4.7 |
| QQQ |
35.85 | 35.92 | 35.84 | 36.16 | 37.10 | Â |
% |
+1.8 | +0.4 | -0.2 | +0.9 | +2.6 | +5.5 |
NYSE |
 |  |  |  |  |  |
T. VOL |
1.35 | 1.30 | 1.47 | 1.52 | 1.61 | 1.45 |
U. VOL |
1.18 | 925 | 819 | 1.04 | 1.10 | 1.01 |
D. VOL |
166 | 360 | 614 | 472 | 493 | 421 |
VR |
88 | 72 | 57 | 69 | 69 | Â |
4 MA |
65 | 75 | 68 | 71 | 67 | Â |
5 RSI |
65 | 70 | 67 | 74 | 81 | Â |
ADV |
2428 | 2186 | 2029 | 2174 | 1752 | 2114 |
DEC |
890 | 1089 | 1263 | 1121 | 1573 | 1187 |
A-D |
+1538 | +1097 | +766 | +1053 | +179 | +4633 |
4 MA |
+581 | +1093 | +923 | +1114 | +774 | Â |
SECTORS |
 |  |  |  |  |  |
SMH |
+1.1 | +0.1 | -0.1 | +1.6 | +3.2 | +5.9 |
| BKX |
+1.5 | +0.4 | -0.3 | +0.7 | -1.2 | +1.1 |
XBD |
+1.6 | +0.2 | +.05 | +1.2 | -0.1 | +3.0 |
RTH |
+1.2 | +0.2 | +0.1 | -0.9 | +0.1 | +0.7 |
CYC |
+1.8 | +1.0 | -0.1 | +0.8 | +1.6 | +5.1 |
PPH |
+1.4 | -0.2 | +0.4 | +0.9 | +1.1 | +3.6 |
OIH |
-0.3 | +2.6 | +0.5 | -2.7 | +0.8 | +0.9 |
| BBH |
+2.1 | -0.3 | -0.6 | +1.9 | +2.1 | +5.2 |
TLT |
-0.7 | -0.7 | +0.5 | -0.3 | -2.5 | -3.7 |
| XAU |
+0.9 | +1.1 | +0.4 | +0.4 | -1.0 | +1.8 |
 ^next^
For Active
Traders
Friday was a no-brainer on the volatility
band
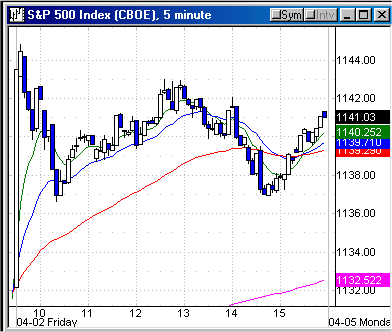
plays, fading the gap openings. The SPX hit 1144.81 on the 9:35 a.m. bar,
with
the 1.5 volatility band at 1144.91. If you played the SPY that opened at
114.81,
+0.9% from the previous 113.78 close, they traded down to 113.94 and a
three-bar
gap pullback long setup. This rallied to 114.64, then back to 113.95, and
then
closed up at 114.64.
The QQQ gapped open +2.0% at 36.89, hitting
37 on
the opening bar. The 2.0 volatility band on Friday was 36.97. The initial
gap
pullback was only to 36.53 and the 20-period EMA. From there, the QQQs traded up
to a 37.16 intraday high, closing at 37.10, which is the .618 retracement to
the
39 high off the 2002 low. Net net, if you have the first-hour strategy
modules,
seminar materials or the new
Sequence Course and didn’t fade the volatility
bands on that overreaction, then you can just look inside at your own
emotions
as the cause.Â
Today’s
Action
This corner has no buy interest into Friday’s
highs at all and will only play intraday long setups on retracements, or
maybe
taking out Friday’s lows, then reversing, depending on how the low is
taken
out. I will leave the continuation trades above Friday’s high to whoever
wants
it, but this corner will emphasize short setups into the beginning of the
1150
resistance zone. If they open up above Friday’s highs, then reverse that
high,
that will be the first initial short opportunity today.
Have a good trading day,
Kevin Haggerty


