My Techniques For Trading With The Intraday Trend
Given that this is the
first of a series of trading lessons relating to my trading style, “scalping†or “hyperactive day
trading,†I thought it would be best to
start with my first — and most useful — rule: Trade With The Trend. Whenever I am mentoring a new trader here in the office, I constantly
reinforce this concept every day. In
fact, if a new trader does a trade where they try to pick the bottom or sell
short the top (i.e., “bucking the trendâ€), they know that within a few moments
I will be reading them the riot act. New
traders have the odds stacked against them already, why make it more difficult?
Now let’s back up for
just a moment. The whole idea
behind scalping is to make as many high-probability trades during trading hours
as possible,
making a few cents on each trade, but trading relatively large size (1000 —
5000 shares per trade). Based on
just that, you have to have a very high win / loss ratio, in order to overcome
commission and losing trades. My
rule-of-thumb is that if your commissions are more than one-third of your
gross profit on a given day, chances are you took some trades that were marginal
— and simply were not worth the effort. That
being said, let’s define what I mean by the “trend.
A scalper’s world is lies
in seconds and minutes. As a
result, I feel the one-minute chart offers the best time frame to identify entry
points. A one-minute chart is how I
define the trend. Is the moving
average sloping up or down?
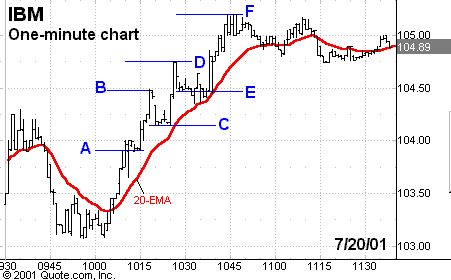
Chart 1
(
IBM |
Quote |
Chart |
News |
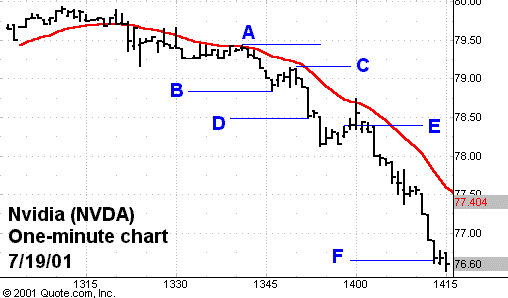
PowerRating) is an upward-trending chart — as indicated by the rising 20-period moving average. Chart 2
(
NVDA |
Quote |
Chart |
News |
PowerRating) is a downward-trending chart. While that may be a bit remedial for most of
our readers, it is important
to focus only on that, initially. Many
traders are distracted by the five- and 15-minute chart, allowing it to influence
their decisions. The five- and 15- are
important, but only after you build a solid foundation.
In future lessons, I will discuss how these time frames are used. Some traders will even focus more on the net change for the day on the
index or stock they are looking at, and use that to override the one-minute
chart. It
does not matter.
Keep it simple:
What is the trend on the one-minute chart?
A scalper is usually not
fortunate enough to the buy the low and sell the high of each intraday move.
More often than not, they will get anywhere from 60%-80% of the move. An average move is usually around
.25 to .45 cents. That being said, take a look again at Chart 1. Notice that the move from
point A to point B is roughly .65, a move that a quick
trader could capitalize on. However,
if you wanted to sell short that rally, point B
to C, you had only a .30 range. Not only is there less for
you to profit on, but you are also relying on
your ability to pick the top, which as we all know, is tough to do. Points C, D and
E show the same scenario.
While points E to F offer great
range, after point F, you will notice that the moving average begins to move
sideways, making it more difficult to optimize entry and exit points. I will usually be on the sidelines during these times.

Chart
1: One-minute chart of IBM with
20-period EMA
Chart 2, Nvidia
(
NVDA |
Quote |
Chart |
News |
PowerRating)
on a one-minute time frame displays the same characteristics. This time, the trend is
down. Selling
short the rallies (points A-B, C-D
and E-F) proved to be a more profitable and safer strategy than
buying the dips (points B-C and D-E).

Chart
2: One-minute chart of NVDA with
20-period EMA
As we all know, there
are many ways to approach the market on this time frame — what I have outlined
here is one of many. There are
times when you need to step outside these rigid rules, but those times are few
and far between. My objective in
this lesson is to help you build a framework from which to trade. I will be the first to admit that I do “bottom fish†and short
rallies, but I believe that that ability comes with time and experience.
Like all things: Start simple and build from there.
I trust you found this
lesson helpful. Please feel free to e-mail me with your comments or questions.
For The Best Trading
Books, Video Courses and Software To Improve Your Trading
