New Highs, New Lows, and Market Cycles
One heuristic that I’ve found useful is to think
of market movements in terms of four-part cycles:
1) A bottoming phase in which prices stabilize
or might move lower, but fewer stocks participate in the weakness, creating
fewer new lows over time;
2) A strength phase in which prices move higher
and a broad number of stocks participate in the move, leading to a steady
expansion of new highs among equities;
3) A topping phase in which prices often
continue higher, but fewer issues participate in the move, creating fewer new
highs over time;
4) A weakness phase in which prices move lower
and a broad number of stocks participate in the move, leading to a steady
expansion of new lows.
This cyclical pattern occurs across multiple
timeframes, making it useful to monitor new highs and new lows on short-,
intermediate-, and longer-term levels. The commonly quoted 52-week new highs
and lows will generally miss short-term cycles in the market, which can be
picked up if you examine new highs and lows over intraday or several-week
periods.
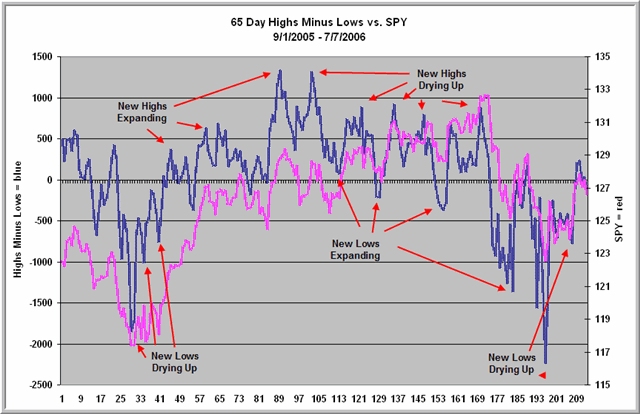
Below is a chart of the S&P 500 Index (SPY; red)
overlaid with a count of the number of NYSE, NASDAQ, and Amex stocks making new
65-day highs minus new 65-day lows (blue). Notice how the new highs and lows
neatly track the phases of the market cycle.

What that means is that, as a trader, you can
become bolder as price movements are validated by participation, as measured by
increasing new highs or lows. When market strength or weakness is not
corroborated by expanding new highs/lows, you can become more cautious and even
look to fade those moves.
A simpler way to follow participation is simply
to note new highs and lows among a representative set of sector ETFs. Market
screening programs such as Trade Ideas
can track these new highs and lows in real time, saving you the pain of
calculation.
Brett N. Steenbarger, Ph.D. is
Associate Clinical Professor of Psychiatry and Behavioral Sciences at SUNY
Upstate Medical University in Syracuse, NY and author of
The Psychology of Trading (Wiley, 2003). As Director of Trader
Development for Kingstree Trading, LLC in Chicago, he has mentored numerous
professional traders and coordinated a training program for traders. An active
trader of the stock indexes, Brett utilizes statistically-based pattern
recognition for intraday trading. Brett does not offer commercial services to
traders, but maintains an archive of articles and a trading blog at
www.brettsteenbarger.com and a
blog of market analytics at
www.traderfeed.blogspot.com. His book, Enhancing Trader Performance,
is due for publication this fall (Wiley).
