Nine Trading Day Mark-Up Window Into 6-Month Report Card For Generals
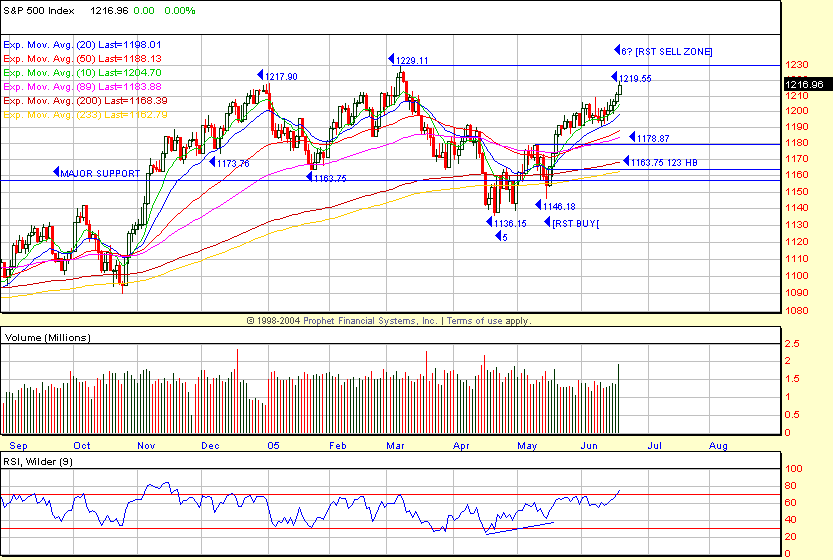
The magnet and objective of the Generals was to
take out last year’s 12/31/04 1211.92 close which happened on expiration Friday
with the 1216.97 close, +0.5% on the day and +1.6% for the week. The SPX
(
$SPX.X |
Quote |
Chart |
News |
PowerRating), to no surprise if you are familiar with how the Generals play
the game, led all the major indices on the week at +1.6% with positive closings
for five straight days. The Dow
(
$INDU |
Quote |
Chart |
News |
PowerRating), 10,623, was +0.4% on Friday and
just +0.8% on the week. The
(
QQQQ |
Quote |
Chart |
News |
PowerRating), 37.89, was +0.9% on the week and flat
on Friday, while the Nasdaq
(
$COMPQ |
Quote |
Chart |
News |
PowerRating) closed at 2090, +1.3% for the week,
just below the 2100 head-and-shoulder neckline and -4.9% below the 2192 bull
cycle high. The SPX 1216.97 close is just -1.0% below the 1229.11 bull-cycle
high and with nine trading days left until the June six-month report card, so
you can bet the ranch that the Generals will make a monster effort to take out
that SPX high barring any new world crisis.
Most mutual funds, as you should know, have
become simply quasi-index funds, and the primary benchmark is the S&P 500, not
the NDX 100 and certainly not the Nasdaq Composite. In fact, the S&P 600 small
cap and S&P 400 mid-cap indices have already taken out their bull market March
highs. Also, the S&P 500, on an equal-weighted basis, made a new all-time high of
1582.78 on Friday which highlights the difference in index calculations, as per
thechartstore.com, an excellent
website for this kind of statistical information (see link). The media tongues
are tied as oil pushes $60 and the SPX approaches new highs, but if it retraces
any this week, it will be, of course, due to higher oil prices. The media’s a
joke.
The market action on Friday was heavily weighted
to Triple Witch Option Expiration. (I don’t recognize stock index futures, as
they are not a real product.) NYSE volume expanded to 1.92 billion shares (1.27
billion up), the volume ratio 67 and breadth +805. The 4 MAs of the volume
ratio, 65, and breadth, +815, are short-term overbought, but that will probably
be worked off sideways, if at all, because of the dominant theme, which is the
Generals pushing their major holdings higher into month-end with just nine
trading days remaining. The sector leaders last week were gold (XAU +4.9%),
energy (OIH +4.6%) and cyclicals (CYC +3.2%, XLB +2.4%). The only sector to
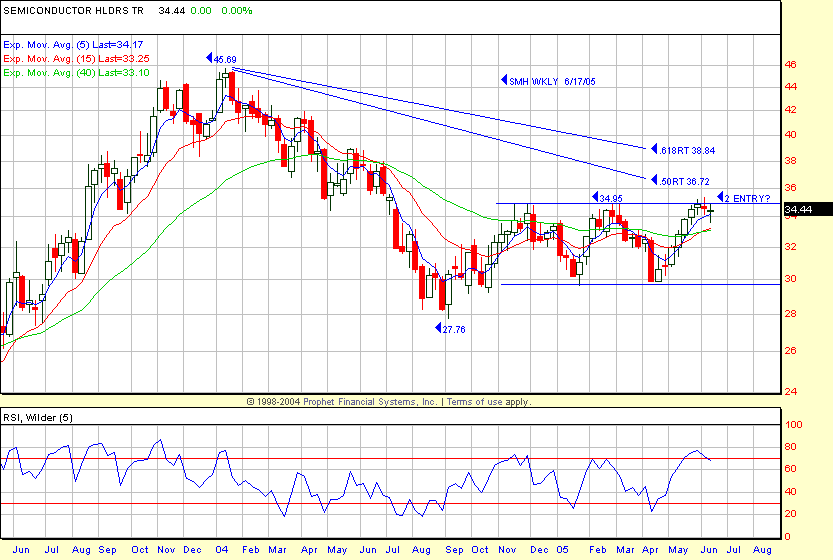
finish red was the semiconductors with the
(
SMH |
Quote |
Chart |
News |
PowerRating) -0.4% on the week to 34.44,
but my guess it that it will get broken out of the upside of its trading range
as the Generals mark-up prices into June month-end (see chart), which is
probably the last opportunity to reduce longer-term equity allocations into
strength, which could include the fifth-wave price continuation to 1254 – 1305
which is only +6.0% to 1305 from 1229. The buy-side game was on the recent
retracement to 1140 – 1160, not on new highs, especially for the majority of you
who thought it was too weak to buy on the retracement and now too strong to sell
into further strength. The same SPX RST sell pattern will set up above 1229 as
it did in 2000 for the SPX, Dow and NDX 100. The higher price goes above 1229,
so goes the risk level and the lower longer-term equity allocations should be
(my opinion).
Have a good trading day,
Kevin Haggerty
P.S. I will be
referring to some charts here:
www.thechartstore.com in the future.

Â

