No bias needed, just trade these levels
Two weeks of steady selling ended with
Friday’s session of orderly ascent in very predictable (tradable) fashion. Have
we seen the end of all selling? Is a bottom in place for 2005? Impossible to
say, and not of any concern for short-term traders regardless. The intraday
trend is our friend, and that often changes from one hour to the next.
ES (+$50 per index point)
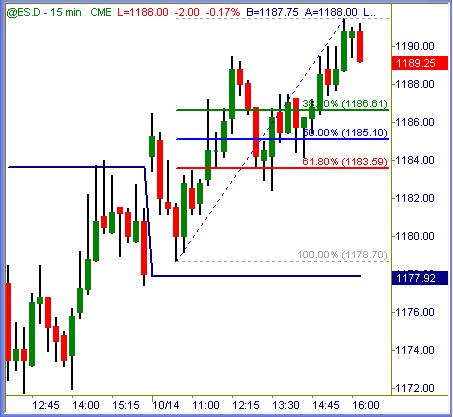
S&P 500 gave an early sell signal near 1184 on
Friday that was good to 1179. From there it bounced just above the daily pivot
and sailed +10pts higher. The subsequent pullback was another buy signal near
1184 that offered at least +6pts upside profit potential into the closing bell.
Orderly, structured and very active session…
on a Friday. Traders who believe that all Friday sessions are poor trading
conditions should file this one away to memory: we will see plenty more Friday
sessions just like that. No prejudice should ever be held against any open
market period, as anything can happen at any given time.
1186.50 and 1185 are zones of support if tested
on an early drop today.
ER (+$100 per index point)
1. Russell 2000 gave sell signals near 628,
covered at 623 for +5pts easy profit.
2. Offered buy signals at the daily pivot that popped +11pts higher.
3. Gave pull back long signal near 630 ~ 631 levels that worked to nearly 636
Nice to see a normal range, orderly session
with clear price structure in its chart from bell to bell!
Today’s initial support levels come in near
630.50 and then 629 on any lower tests ahead.

This Session:
ES (+$50 per index point)
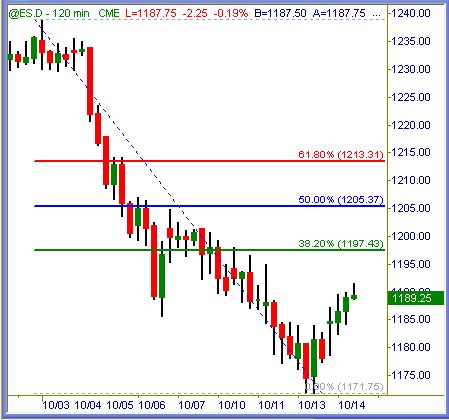
The entire trading world sees initial
resistance near 1198 and then 1205 for the S&Ps above. From current resting
prices below 1190, there is plenty of upside room to run before retests of
selling pressure happen. Those magnets above are likely to be tested this week,
and probably sooner than later. Should offer solid long trade opportunity along
the way.
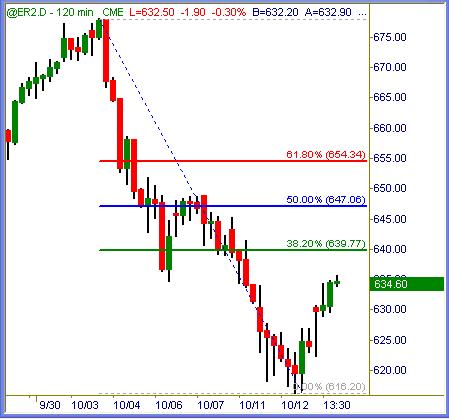
ER (+$100 per index point)
640 and 647 are two of several obvious price
magnets for the Russell 2000. While this index may not make it much past either
of those on any rallies ahead, one – both price magnets are probable to be
tested soon. Zealous shorts who insist on hitting any breakdowns this week
expecting momentum to carry like it did before are likely to be real
disappointed this time around.
Summation
Selling pressure will resume if key levels of support are broken, but
more likely we will see some rising in relief toward higher price targets above.
The recent leg downward should run into serious resistance at 38% and 50% of its
retracement upward, and we can probably expect to see that this week.
Buying support and targeting resistance levels
as probable profit targets today. On any sudden spikes to said resistance levels
posted above, just reverse the process. Shorting resistance and covering near
support if/when given the chance. Lastly, if recent support levels near Friday
lows break and price action lifts up to test them as support, expect selling
pressure to rain down on them right there.
Intraday ranges are normal once again,
numerous opportunities for profit exist nearly every day. What else can an emini
trader ask for? ;>)
Trade To Win
Austin P
(free pivot point calculator, much more inside)
Austin Passamonte is a full-time
professional trader who specializes in E-mini stock index futures, equity
options and commodity markets.
Mr. Passamonte’s trading approach uses proprietary chart patterns found on an
intraday basis. Austin trades privately in the Finger Lakes region of New York.