No Reason To Buy O/B Market with Negative Divergence
From 1990 to 1997, Kevin Haggerty served as Senior Vice President for Equity Trading at Fidelity Capital Markets, Boston, a division of Fidelity Investments. He was responsible for all U.S. institutional Listed, OTC and Option trading in addition to all major Exchange Floor Executions. For a free trial to Kevin’s Daily Trading Report, please click here.
Commentary for 4/23/12
The SPX finished the session +0.1% to 1378.53, and was +0.6% for the week. The economic numbers were soft and the sovereign debt noise increased, but the SPX traded in a relatively narrow range on the week from 1392.76-1365.38, and that is also the range for the past 7 days with the 50DEMA at 1371.44.
Despite the headline news, and daily magnification of it by the empty suits on CNBC and the other regular pundits, the SPX has essentially been range bound since mid-March. There was a 2.5% range [1422.38-1386.87] from 3/14/12-4/9/12, followed by a two day decline to 1357.38, and now the SPX is in an 8 day 2.0% range from 1392.76-1365.38, which is also last weeks high-low range.
The SPX is -1.9% for the last 30 days and the shift to a defensive posture by the Generals is evident by the fact that the leaders for the last 30 days are the XLP [Consumer Staples] +2.1%, XLU [Utilities] +2.0%, and XLV [Health Care] +2.0%.
The sovereign debt noise on Spain, Italy, Portugal etc continues, but like China, it is always conflicting news. The Euro sovereign debt news always proves to be part truth and the rest fiction, but in the end it will get far worse than anyone will admit. The question is if anyone else other than the ECB etc is buying this garbage debt from Spain, Italy etc, and if so, how much of it. My guess is that the foreign central bankers including our man Bernanke are responsible for almost all of it. How can that be a good thing other than to prolong the “Ponzi Scheme”.
This earnings season is always a managed expectation game, and the current one is ridiculous, but based on the current SPX trading range the market is not buying or selling the hype. The one specific is the leadership of the defensive issues for the past month or so, which is a red alert as the Generals position themselves for more potential downside risk. However, the “herd”, and the bond market expects the Fed to continue QE after Operation Twist supposedly comes to an end in June. The 10-Year treasury yield continues to trade below 2.0%.
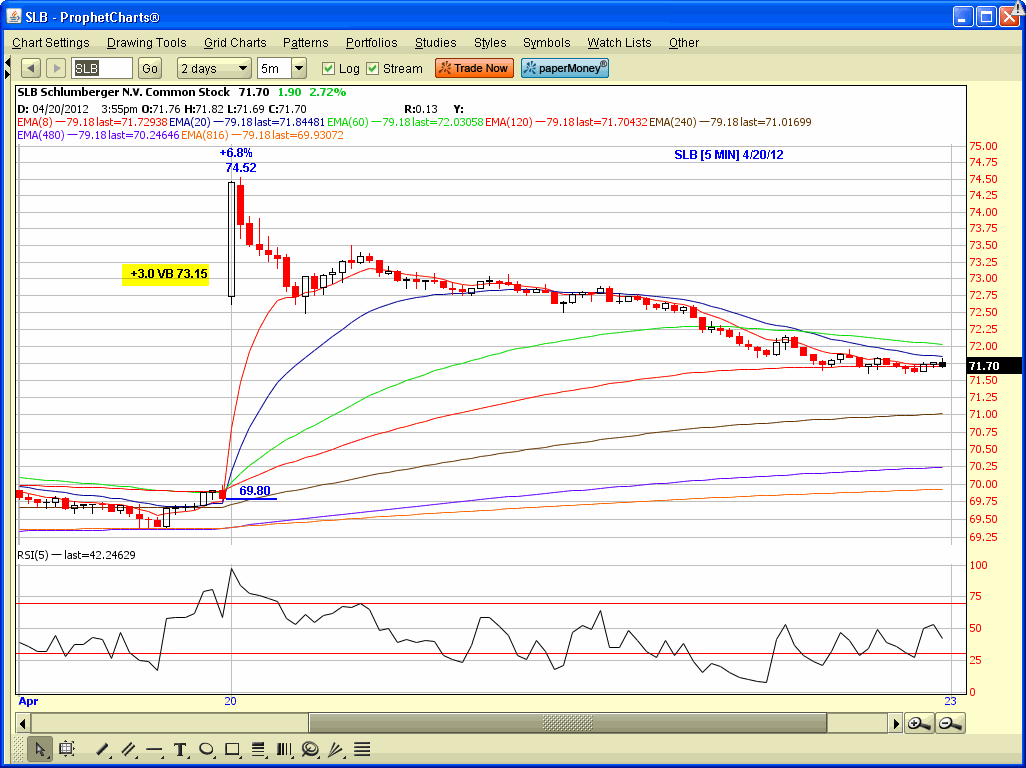
Electronic execution is a joke in the opening period, and is a real bonus for day traders. This was never more evident than Fri following the SLB earnings report. The stock traded beyond the +3.0 VB [one-day STDV] on the opening bar, made a 74.52 high on the 9:35AM bar, or +6.8% versus the previous 69.80 close, then immediately reversed trading down to a 71.70 close [thank you EEX] Learn more about trading extended and contracted volatility situations by taking a free one week trial to my Trading Service available on the TM`s site.
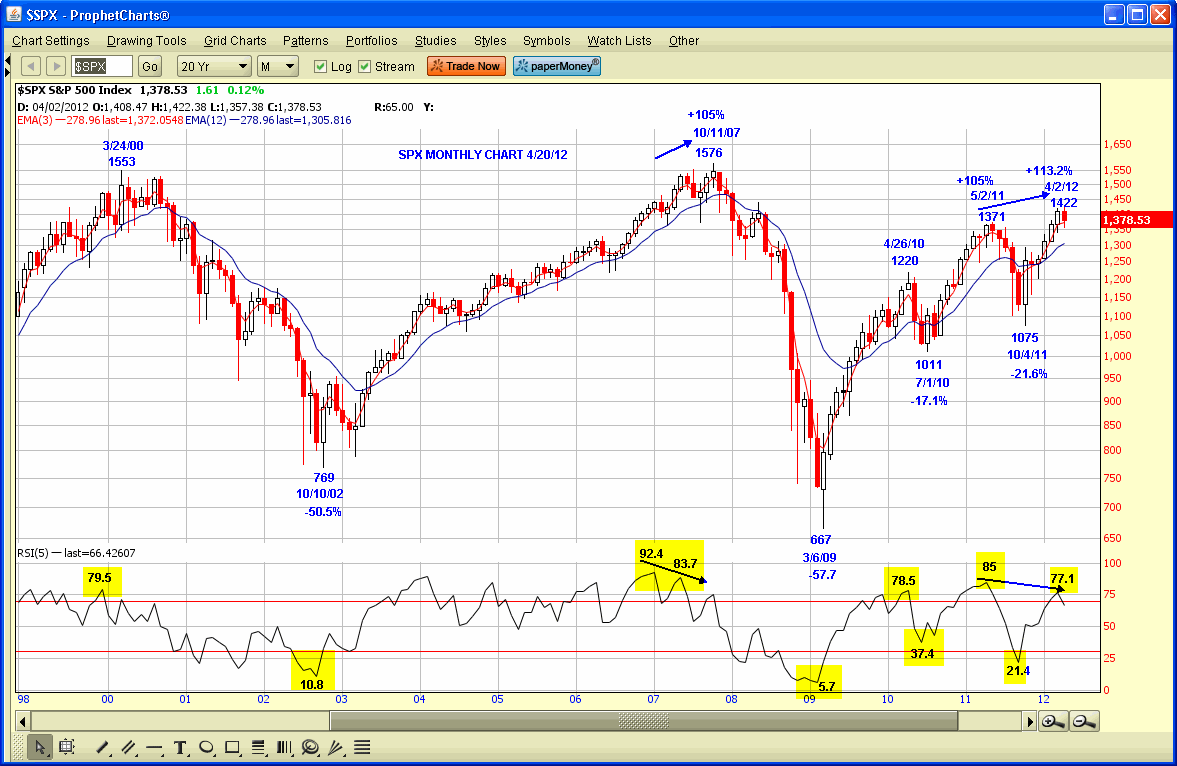
There is some anticipated Geometric symmetry in June, and there is currently an SPX O/B negative 5 RSI monthly divergence, so it is a significant time period. All significant reversals market reversals can be anticipated using the primary Geometric Tools including Pi, Square Root relationships and/or Fibonacci, confirmed by other technical evidence as you see on the SPX monthly chart. All of the reversals outlined on the chart had significant Geometric symmetry, and that has been true historically, and will always be the case going forward. Markets may change, but Geometric symmetry will always remain constant.
If you go to the site www.geometricmarkets.com you can download for free 6 of my calculators that I use to measure price and time symmetry, and the brand new 200+ page manual “Markets Trade with Geometric Symmetry” is also available for purchase.


Click here to find full details on Kevin’s courses including Trading with the Generals with over 20 hours of professional market strategies. And for a free trial to Kevin’s daily trading service, click here.
