Oil: Just A Pull Back OR Change In Trend?
The price of oil is dominating the world’s economic news lately. A massive, powerful and short crushing uptrend has been underway since January 2007. Every murmur and rumor out of the Middle East is causing severe reactions in price. Wars, storms, strikes, terrorism, and supply/demand concerns are magnified in effect, due to the intense scrutiny being paid to this economically critical commodity.
The entire U.S. stock market seems to be tied to the price of oil; oil goes up, the market falls and vice versa. Even the weak state of the U.S. Dollar sways with the price of oil. Every pull back since 2007, has been answered with another surge ahead. However, there are several very important differences between the current pull back in price and the ones in the past.
First, this decrease was the steepest 4-day decline in oil trading history. Secondly, price broke the 50-day Simple Moving Average on the daily chart for the first time during a pull back. The SMA is now at $133.39 on the daily chart. Some technicians would consider this a strong sell, or go short signal. Price is still nicely above the 200-day SMA which is presently at $106.58. Fundamentally, this severe pullback seems to have its genesis in slowing demand due to general economic weakness and a perceived easing in U.S.-Iran tensions. Perhaps, the fact that average oil inventory has not decreased during the run up is starting to sink into traders’ minds, slowing the speculative frenzy.

Today, a bounce back from this decline is underway. Oil flirted with the 50-day SMA level, fell back and is now up around .22 cents on the day to $129.10, nicely below the technically critical 50-day SMA. This bounce is being attributed to a potential severe storm in the Gulf of Mexico and what appears to be a short term failure in the Iran negotiations. In my opinion, these are very weak reasons for a bounce in oil prices today.
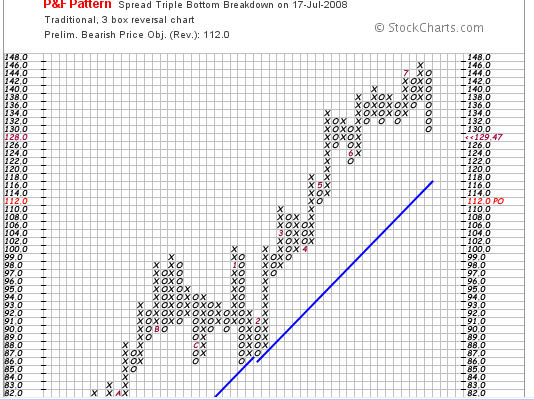
You can see from the Point and Figure Chart that a triple bottom breakdown has occurred with a bearish price objective of $112.
It’s my contention that the preponderance of the evidence indicates that this pull back is not finished and may actually be a change in trend. How long will this last, is the question.
Regardless of your bias in the oil market, be sure to trade only with risk capital and position size accordingly.
Best Wishes!
David Goodboy is Vice President of Marketing for a New York City based multi-strategy fund.