Oil Service Holders Setting Up
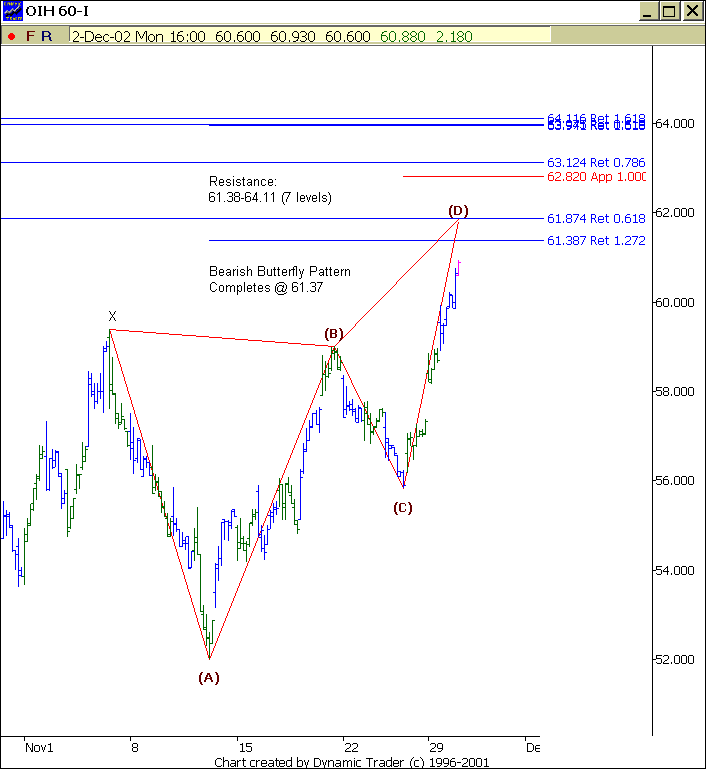
This Exchange Traded Fund
(ETF) is in the process of completing a Bearish Butterfly pattern on the 60-minute chart below. This suggests that once the pattern is complete and price
hits our Fibonacci price resistance zone, the Oil
Service HOLDRs
(
OIH |
Quote |
Chart |
News |
PowerRating) have a high likelihood of reversing to the downside.
So I’m looking to tighten stops on any longs around this zone and even consider
taking profits. Once the pattern is complete we can even consider looking for
short trades while keeping risk to no greater than just above our Fibonacci
price zone. If
(
OIH |
Quote |
Chart |
News |
PowerRating) continues
up through this price resistance area, then I have to start looking to buy pullbacks.

