Oil Services Holders At The Crossroads
Oh boy! Is it ever heating up in the Oil Service HOLDRs (OIH). There is a very interesting
development in this sector. Let’s look at the daily and weekly charts.
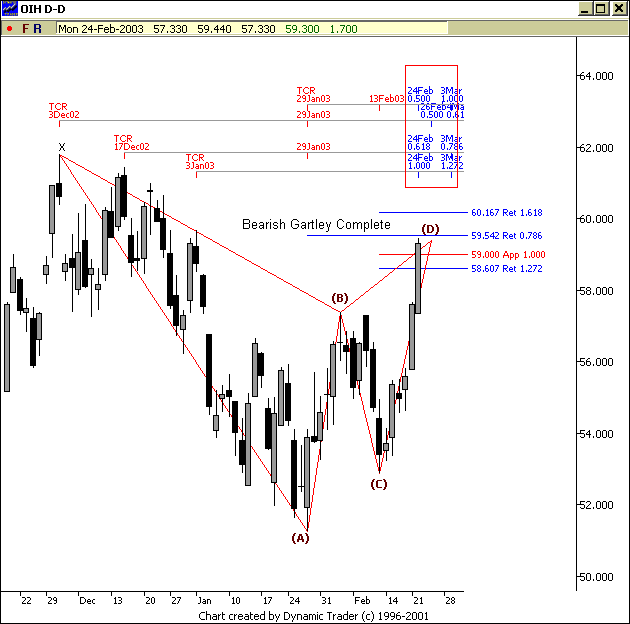
First on the
daily chart,
(
OIH |
Quote |
Chart |
News |
PowerRating) has completed a
Bearish Gartley
pattern into a Fibonacci price resistance zone. We also have two sets of time
cycles to deal with. The first set of time cycles is between Feb. 24 and 26. With pattern, price, and time
aligning we may see a reversal to the downside around this price resistance
zone.

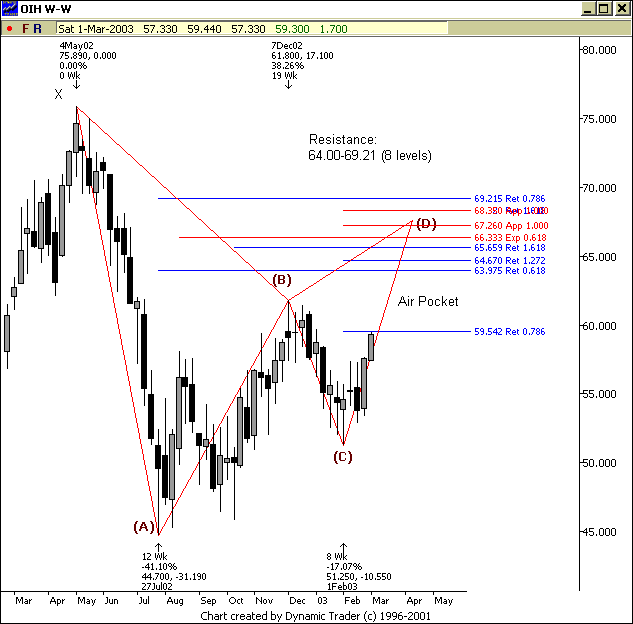
Now, the flipside
to this scenario can be seen if you take a peek at the weekly chart below. Basically
the 59.50-60.00 level is a critical point for OIH. If this HOLDR pushes up through
this price level there is an “Air Pocket” with no Fibonacci price resistance
levels. This translates to the potential for a significant move up if price
is able to poke through the .786 retracement at 59.54. Basically, we could see
a 4 to 5 point gain in a relatively small amount of time without any Fibonacci
price resistance levels.

So what’s my
plan? Well, I’m current long OIH. However, I did take half of my original position
off today as we completed the Bearish Gartley pattern on the daily chart. I
kept half in the event we push through daily resistance and start running up
to the focus Weekly chart resistance zone from 64.00-69.21. In fact, with such
a large price resistance zone on the weekly chart AND a bigger picture Bearish
Gartley forming on the weekly chart that completes up around 69.00 (point D),
my translation of these charts are that we magnetized up to the 64-68 price
range. However, my stop has been trailed up to lock in profits on the long position
and I have taken half the position off for a nice gain. So, if I’m wrong about
moving higher I get stopped out and I move on.
Educational
note: You’ll hear mixed messages about analyzing different time frames, but
I think it is critical to know what the “Weekly” chart looks like before considering
a position on the “Daily” chart. So I am definitely in the camp of multiple
time frame analysis.
Monday Afternoon
Quiz:
1) How many barrels of
oil do we have in the Strategic Petroleum Reserve?2) What is the capacity of the Reserve?
3) How many days will that last if we have to use it solely for the US needs?
To make it interesting…a free month of
my report to the first person to get
it right.
