Oil to 80? Strategies for Profit
Oil prices have been dominating the financial and consumer news recently. It’s for good reason as oil has the U.S. economy in a stranglehold. Like it or not, the United States near term economic health rests squarely on the price of oil. Even the stock market itself appears to be directly correlated with the ebb and flow of oil supply and demand.
There has been a huge push to get alternative fuels on line, however, full implementation is still years away. Oil prices have skyrocketed over the last 18 months. In January of 2007, oil was trading as low as $51.03/barrel. This is difficult for many to believe, given the severe run up since that time. Price almost doubled in 2007 to $100.09/barrel prior to pulling back to 85.42 in early 2008. The uptrend continued from this point until a high of $147.90/barrel was hit on July 11, 2008. What is most interesting is that supplies did not deviate much from their average during this run up. This was clue number one that the move up would be short lived.
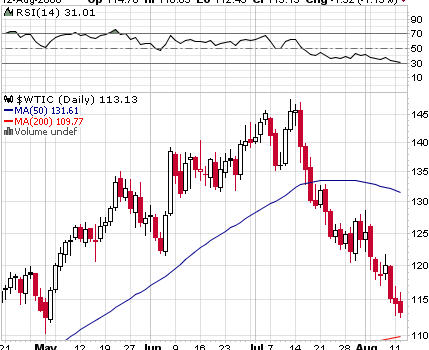
At this time, the end of the world crew was in full effect predicting oil to be over $200.00 by the end of 2008. The more radical “Peak Oil†fringe of this movement was making $500.00/barrel projections with a straight face. Experienced analysts and traders saw this hype as a clear sign of a top, as has happened numerous times in the past. Whenever the hype machine gets out of control, market moves are usually over and a reversal is imminent. Price started to drop and drop fast once the high was hit. The 50-day Simple Moving Average was pierced clearly just 3 trading days after the high and a rapid decent followed.
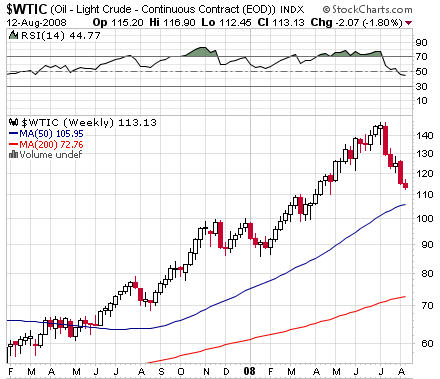
Price is still above the 200-day SMA which is 109.77. It is also above the 50-week SMA at 105.95 and the 200-week SMA which is all the way down at 72.76. What’s interesting to note, is that a 50% retracement from the highs places price just $1.19 above the 200-week Simple Moving Average at $73.95/barrel. These moves are clearly illustrated on the following 2 charts:
Gasoline is how most consumers feel the effect of the price of oil. The dropping price has led gasoline lower at the pump for the 26th day in a row yesterday. The average price at the pump is now less than $3.80/gallon. The media is pointing at a slowing of demand and a stronger dollar as the root cause of the decline. The Energy Information Administration EIA is stating increased production capacity is the prime mover behind the decline. Just today, the EIA announced that supplies dropped last week causing prices to jump up $1.84 thus far to $114.85. As you can see, it is uncertain if price will complete a 50% retracement or simply resume the uptrend from here.
What’s the best way for a swing trader to play oil right now? Here are several option strategies to implement depending on you bias. I am using the ETF USO as a proxy for oil, have a 3 month time frame and am willing to risk $2000.00 to express my bias.
BULLISH
Call Back Spread— Buy 2 January 2009 102 Calls IYSAX at $7.70
Sell 1 January 2009 93 Call IYSAO at $10.70
Your total investment is $470.00, the maximum loss is $1370.00 and maximum gain is unlimited.
NEUTRAL
Long Strangle— Buy 1 January 2009 102 Call IYSAX at $7.50
Buy 1 January 2009 84 Put UNAMF at $7.10
Your total investment is $1460, the maximum loss is $1460.00 and maximum gain is unlimited
BEARISH
Put Back Spread— Buy 4 January 2009 84 Puts UNAMF at $7.10
Sell 2 January 2009 88 Puts UNAMJ at $8.60
Your total investment is $1120, the maximum loss is $1920.00, and the maximum gain is $14880.00
Regardless of your opinion on oil, one of these strategies should serve you well. Remember, option trading is inherently risky, use only capital that you can afford to lose.
Best wishes!
David Goodboy is Vice President of Marketing for a New York City based multi-strategy fund.