Oil, Which Way Will You Go? Strategies For Profit
Oil was in a rip roaring bull market over the last several years. Fortunes were made and many short trend faders had their accounts crushed by the powerful directional price momentum. Every pullback in price was answered by an even stronger reaction rally, as oil spiraled higher and higher.
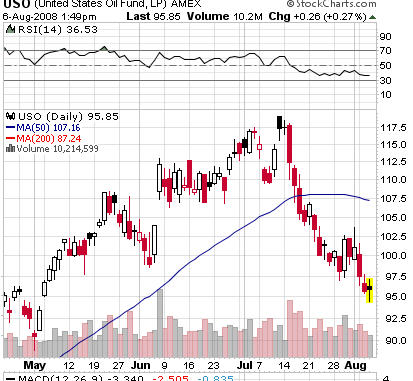
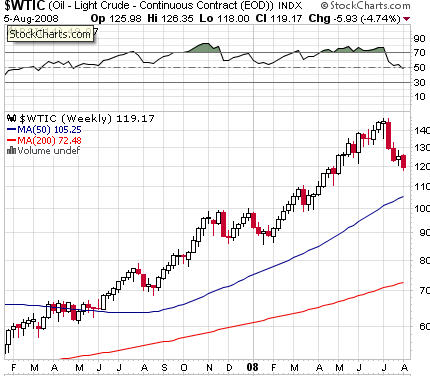
The 50 and 200-day Simple Moving Averages appeared to hold prices above them like an upward thrusting air current. Price would pullback near the 50-day SMA, then bounce back resuming the uptrend. A record high of $147.27/barrel was hit on July 11th 2008. Many pundits were predicting $200.00/barrel plus prices by the end of 2008. Several on the radical economic fringe were calling for oil to break $500.00/barrel by the decades end.
The hype machine was in full force as oil hit its peak. Oil, then started inexplicitly dropping, from the record high. Buyers were heavily buying the pullback, expecting the 50-day SMA to hold again, like it did so many times in the past. Much to the oil bulls’ chagrin, price shattered the 50-day SMA like a knife cutting butter, stopping out many of the hardcore bulls. Price has continued its unexpected decent to as low as $117.14/barrel, which is greater than a 20% decline. It is commonly believed that a 20% or greater decline from the highs is the definition of a bear market. This is a classic example of how perceptions can change quickly in the commodity markets. The global economic malaise, U.S. Dollar strength, weakening demand as price forces consumption cutbacks, and supply increase projections all combined to knock oil off its steady and powerful rise.
This article will focus on several option strategies traders can use to express their bias as to where oil prices are headed next. I am going to use the United States Oil Fund ETF, ticker symbol,
(
USO |
Quote |
Chart |
News |
PowerRating) as the underlying instrument. USO is built by a combination of oil futures, forwards, and swaps. It attempts to track West Texas Intermediary light sweet crude oil prices. I believe it’s an excellent proxy to trading the futures outright and is easily accessible to the stock and option trader.
Here are 3 option strategies for today to fit your oil bias. I have a 3 month time horizon and a $2000.00 investment risk amount inherent in each tactic.
BULLISH—