One Way To Use The MACD Histogram
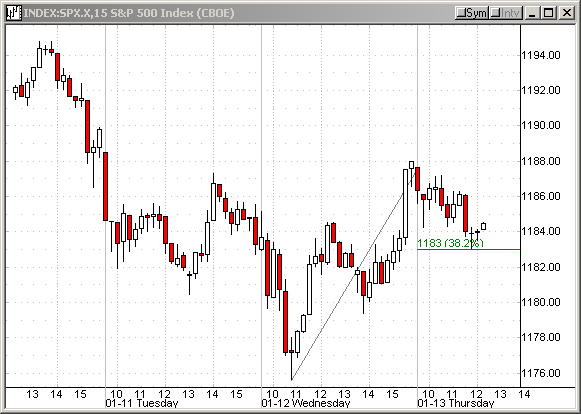
What happened to
yesterday afternoon’s rally? We see no follow-though so far. As you
can see on the 15-minute chart below, the S&P 500 Index ($SPX.X) is
currently bouncing off the 38.2% retracement level. Can we expect another
afternoon rally?   Â

11:11:15 (From TradersWire)
![]()
|
Action |
Symbol |
Order Type |
Setup |
Stop |
Initial Target |
Current Price |
Posted By |
|
Buy |
MSO |
buy at MKT |
pullback |
27.74 |
28.15 |
27.93 |
TK |
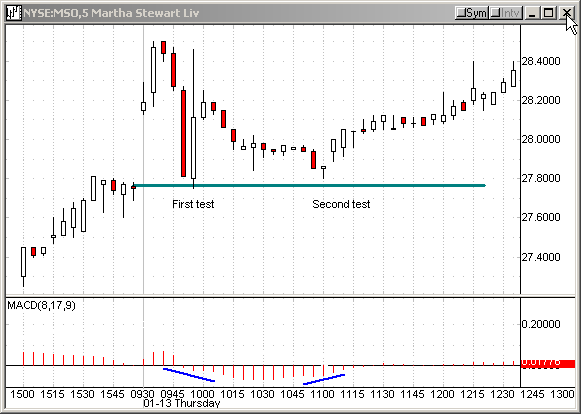
Although Martha Stewart Living
Omnimedia (MSO) gapped up at the open, it could not sustain its momentum.
Shortly before 10:00 AM, MSO tested the lower boundary of a gap zone. Notice,
the MACD histogram was still falling. Now, look at the second test of the
boundary. The MACD was showing an improvement. We decided to buy the stock after
observing a bounce.
11:37:41
Follow up on MSO
It is struggling to take out 28.10. Selling it for a 10-cent gain.

Feel free to mail me your questions.
