Openings Account for 75% of SPX Gains
Kevin Haggerty is a full-time
professional trader who was head of trading for Fidelity Capital Markets for
seven years. Would you like Kevin to alert you of opportunities in stocks, the
SPYs, QQQQs (and more) for the next day’s trading?
Click here for a free one-week trial to Kevin Haggerty’s Professional
Trading Service or call 888-484-8220 ext. 1.
The SPX took out the 1461.57 previous cycle high
on Monday, and closed the week at +31.5 points (+2.2%) to 1484.34. Real
inflation continues to climb, as economic growth slows, despite the spin numbers
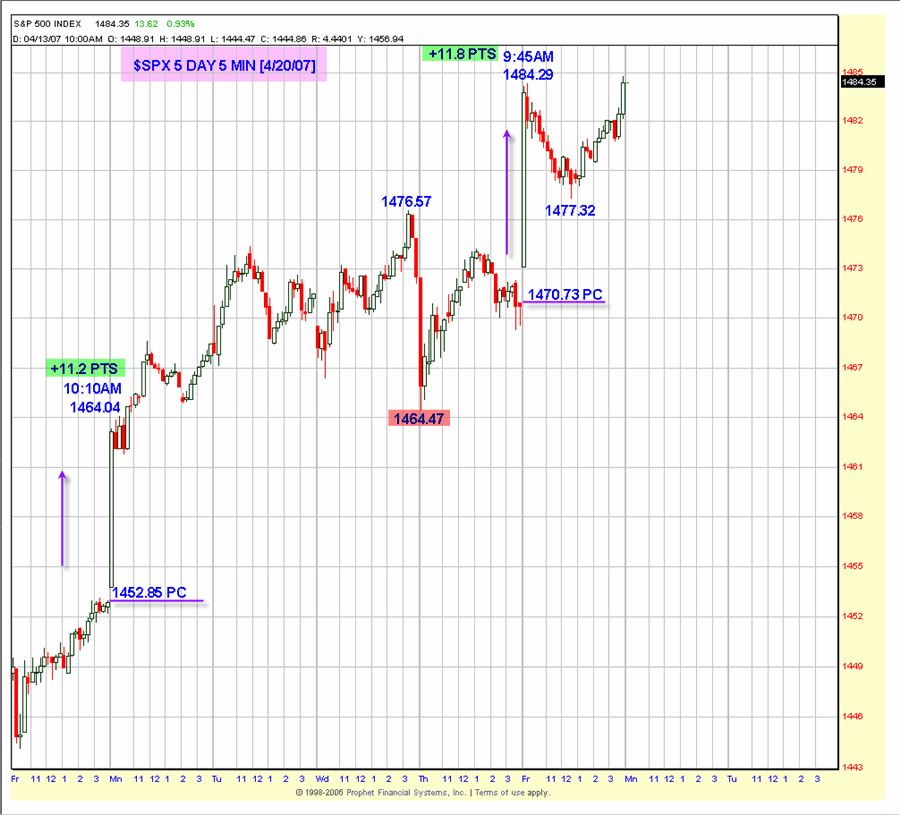
put out by the government. About 75% of the total SPX gain last week was
on the futures-accelerated premium openings on Monday and Friday. The SPX
traded on Monday to 1464.04 on the 10:10 AM bar from the previous 1452.84 close.
Then on Friday, it gapped open to 1484.29 on the 9:45 AM bar from the previous
1470.73 close. Therefore, almost the entire gain last week was accelerated
by the S&P futures trading in the pre-9:30 AM illiquid Globex market, in less
than just 1 hour of NYSE trading.
There was earnings season hype that will be
forgotten shortly as the "better than" game is on for many companies that had
already lowered estimates several times. Of course the spin-meisters on
CNBC never say "better than the previous 2 estimates." There was also
significant option expiration activity, in addition to real buyers by the
generals and some short squeeze activity. NYSE volume expanded on
expiration Friday to 1.9 billion shares, with the volume ratio 80 and breadth
+1882. However, it is interesting to note that the up volume/down volume
ratio for the week was still negative at .96, in addition to the 4 MA’s of the
volume ratio and breadth only 55 and +103. All of this reflects the weekly
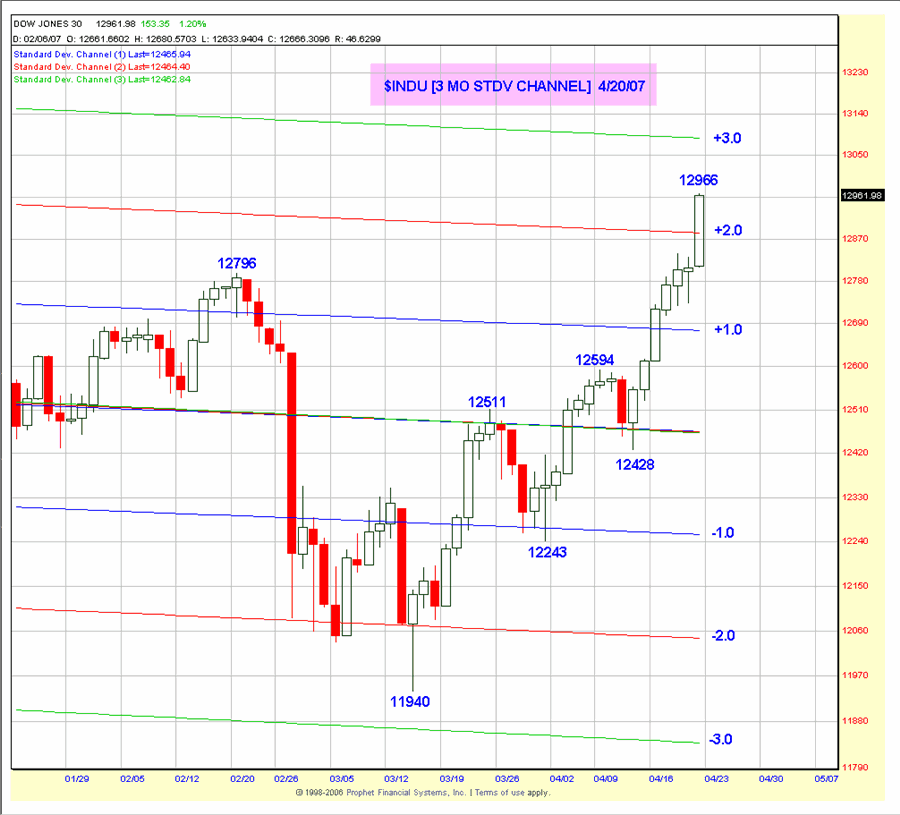
+1.20% and +2.7% gains for the SPX and $INDU. It does give you insight
into how the major indexes are being pushed higher by the pre-market futures and
stock specific gains in a useless but widely followed price index like the $INDU.
The SPX hit 1484.29 on the 9:45 AM bar (Friday)
on the 5-minute chart, and daytraders jumped on this valid short entry, because
there was symmetry with the +1.5 Volatility Band 1483.31 and also some
longer-term price and time symmetry outlined with the trading service, which you
can study with a free trial. The decline was only to 1477.32. That
was it on the day, until Market On Close (MOC), when the SPX traded from 1481.74
to 1484.74 before closing at 1484.35. The $INDU is now the most extended
on a 3-month standard deviation basis, as you can see on the chart, and will
have a sharp pullback shortly. But maybe the CNCB "midnight madness" 13000
hype will get it there sometime today. If it is on another opening gap
like last Monday and Friday, please clock a red sell ticket for me.
The primary focus is on trading the reactions in
the major indexes and ETFs, in addition to the energy stocks, which look like
they are ready to make another advance after a short pullback.
Have a good trading day,
Kevin Haggerty
Check out Kevin’s
strategies and more in the
1st Hour Reversals Module,
Sequence Trading Module,
Trading With The Generals 2004 and the
1-2-3 Trading Module.


