Opportunities in Tech are Close at Hand
Stocks gapped lower on yesterday
morning’s open, but buyers immediately stepped in and provided support.
Strength in the Nasdaq enabled the broad market to subsequently reverse and
trend higher throughout the rest of the day. Each of the major indices finished
in the plus column and near their intraday highs. After shaking off an opening
loss of 0.6%, the Nasdaq Composite closed higher by the same percentage. Like
the previous day, both the S&P 500 and Dow Jones Industrial Average showed
relative weakness, limiting each index to a gain of only 0.2%. The small-cap
Russell 2000 also lagged behind by edging only 0.1% higher, while the S&P Midcap
400 advanced 0.3%.
Turnover in both exchanges was mixed. Total volume in the NYSE
declined by 8%, but volume in the Nasdaq was 5% higher than the previous day’s
level. Despite the previous sessions’s “churning” action, the Nasdaq followed up
with a confirmed “accumulation day” that was indicative of institutional buying,
the first of the new year. Confirming yesterday’s broad market price divergence,
market internals in the Nasdaq were more positive than the NYSE. In the Nasdaq,
advancing volume exceeded declining volume by a healthy margin of nearly 3 to 1.
The NYSE ratio, however, was positive by only 1.2 to 1.
Throughout most of last November and December, the Nasdaq
showed relative weakness by trading sideways while both the S&P and Dow were
posting new highs. But so far in the new year, the opposite is true.
Institutional money flow and sector rotation into the technology stocks has
already enabled the Nasdaq Composite to post a solid gain of 1.8% since the
beginning of 2007, but all the other major indices are still in the red. The S&P
500 remains stuck in the bottom half of a choppy, sideways range that has been
in effect since the start of the new year, with its 50-day MA below and 20-day
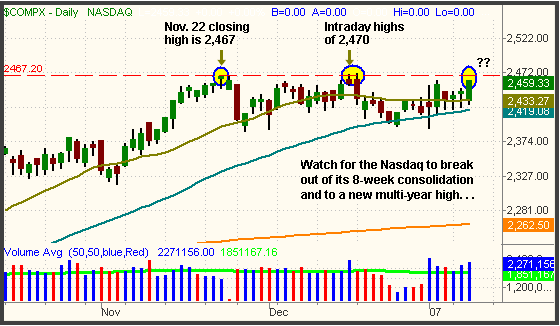
MA overhead. The Nasdaq, however, closed at its highest level of the month and
is now within a couple points of breaking out to a new multi-year high. With
nine weeks of sideways consolidation, a breakout to a new high could generate a
decent amount of upward momentum. Watch for a potential break of the 2,467 to
2,470 area in the coming days:

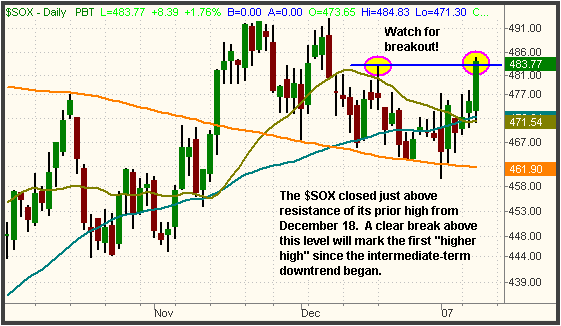
The Semiconductor Index ($SOX) broke out above the top of its
five-day range yesterday, zooming 1.8% higher in the process. The index also
closed just a hair above resistance of its prior high of 483 that was set on
December 18. If the $SOX manages to firmly break out above that level over the
next few days, it will represent the first significant “higher high” since the
index entered into a downtrend eight weeks ago. A subsequent “higher low” would
confirm a bullish trend reversal. Though it tested key support of its 200-day MA
about six times since the beginning of December, the pivotal moving average
acted like a springboard that refused to let the $SOX fall below it:

The Semiconductor HOLDR
(
SMH |
Quote |
Chart |
News |
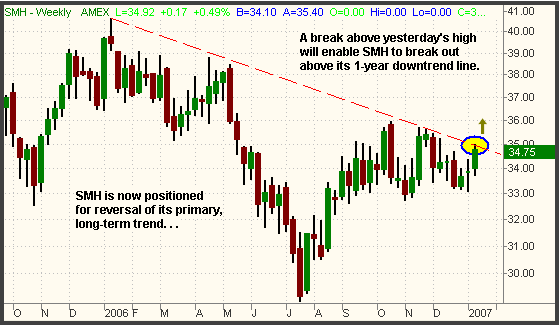
PowerRating), which has been stuck in a
choppy, sloppy sideways range for the past five months, may finally be poised to
break out above resistance of its long-term downtrend that began with the high
of exactly one year ago. As you can see on the weekly chart below, SMH closed
right at the upper channel of its primary downtrend line:

Prior to yesterday, we had been advocating general avoidance
of new positions on both sides of the market. However, with such positive money
flow into the tech stocks making itself known, purchases in the Semiconductor,
Software, Hardware, or Internet sectors are relatively low risk. We especially
like the idea of buying SMH for an intermediate-term trade on a breakout above
its weekly downtrend line. Nevertheless, most of the “old economy” sectors that
comprise the S&P and Dow have not yet set up for long entry points. The
exception is the Securities Broker-Dealer Index ($XBD), which closed at a fresh
record high yesterday. Recall from the commentary of a few days ago that the
StreetTRACKS Capital Markets
(
KCE |
Quote |
Chart |
News |
PowerRating) is probably the best ETF for that sector.
Like the $XBD index, KCE also set a new all-time high, but you’re still better
off focusing new ETF purchases on the tech arena.
Open ETF positions:
Long SDS, MZZ (regular subscribers to
The Wagner Daily
receive detailed stop and target prices on open positions and detailed setup
information on new ETF trade entry prices. Intraday e-mail alerts are also sent
as needed.)
Deron Wagner is the head trader
of Morpheus Capital Hedge Fund and founder of Morpheus Trading Group (morpheustrading.com),
which he launched in 2001. Wagner appears on his best-selling video, Sector
Trading Strategies (Marketplace Books, June 2002), and is co-author of both The
Long-Term Day Trader (Career Press, April 2000) and The After-Hours Trader
(McGraw Hill, August 2000). Past television appearances include CNBC, ABC, and
Yahoo! FinanceVision. He is also a frequent guest speaker at various trading and
financial conferences around the world. For a free trial to the full version of
The Wagner Daily or to learn about Deron’s other services, visit
morpheustrading.com or send an e-mail to
deron@morpheustrading.com .
