ORCL Day, Then TLAB Day
Yesterday
was like the shell game on the streets. They
show it to you and then you think you know which shell the pill is under, but
surprise on you, missed again! We expected at least a reflex rally to the
breakdown point which is 1768 for the Nasdaq 100
(
NDX |
Quote |
Chart |
News |
PowerRating) and 1246 for the S&P 500
(
SPX |
Quote |
Chart |
News |
PowerRating). Problem is, the NDX almost did that on the opening and first three
bars of yesterday’s session. The NDX opened up 70 points or 4.2% at 1736, traded
to 1746 by the third bar, and then retraced 66% of the gap and resumed the
direction of the open.Â
With the exaggerated
opening, there were many 1.5 to 2.0 Volatility Band trades to fade with the
market makers, who made an absolute killing yesterday on the early emotion — as
they filled that emotion at premium prices. I hope you caught some of it too.
The resumption in the direction of the gap opening didn’t last but 16 bars
before a knife down to the 3:30 p.m. intraday low of 1657, then closing at
1675.90, just an odd lot above the previous close of 1666.47.
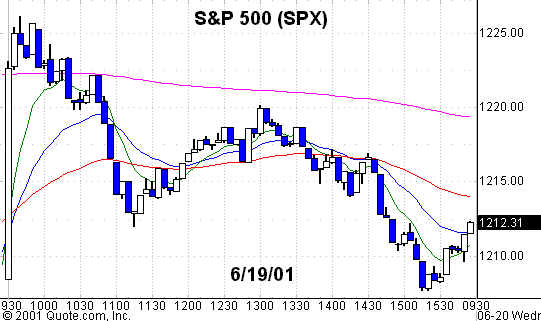
The SPX ran to 1226 by the
third bar but had the same fate, trading down to an intraday low of 1208,
closing in the bottom of its range at 1212.58. The NDX opening was exaggerated
by an oversold condition, coupled with the absurd notion that the tech sector
could be turning around because
(
ORCL |
Quote |
Chart |
News |
PowerRating) beat lowered expectations by a
penny. FYI, lowered more than once.
Of course the TV media
started the usual hype and the buy orders came rushing in — except it was to
where fools dare to tread: right into the market makers’ lair. As a daytrader,
you have the volatility band tool to react to emotion and if you didn’t use it
yesterday, then review it from my lesson on the site. Those of you who have
attended my seminars are well versed on the strategy that continually puts you
on the side of the market makers and specialists.
In some stocks yesterday,
like
(
INTC |
Quote |
Chart |
News |
PowerRating), you got to the 2.0 Volatility Band both ways. INTC opened at
28.5, hit 28.90 at the 2.0 band level, then reversed, trading down to the
negative 2.0 band zone, hitting 26, then reflexed back up to 26.70, closing at
26.67. Yes, that’s the same INTC the similar hype took to 32 just seven days ago
as the TV empty suits were blowing the Intel horn.Â
After that NDX opening
yesterday, the last thing you probably expected was another short opportunity on
a reversal of the previous day’s lows by many of the stocks that had big early
rallies. Well, if that was the case, you weren’t alone — I didn’t either.
Several examples were
(
NVLS |
Quote |
Chart |
News |
PowerRating),
(
KLAC |
Quote |
Chart |
News |
PowerRating),
(
NVDA |
Quote |
Chart |
News |
PowerRating) and some of the
biotech stocks, all of which were big green early on.
Today we start out with the
TV hype on
(
TLAB |
Quote |
Chart |
News |
PowerRating)‘s negative results. Of course that’s not expected — and
you buy ice in February, right? The stock is already a three bagger on the
downside from 67 in February of this year to 20 5/8 yesterday. It’s more a
question of which telecom or related stays in business and/or defaults on their
debt. The vulture arbitrage community are looking at what discount they can buy
the corporate bonds and deciding what ratio of common stock to short against the
corporate bonds. Please don’t email me on how to do that because you can’t.
Period.
Stocks
Today
|
(September
|
||
|
Fair Value
|
Buy
|
Sell
|
|
8.50
|
 9.70  |
 7.40 Â
|
Yesterday I said that
intraday setups would dominate and today it is even more so. We start the
pre-opening with the S&Ps -7 and the NDX futures -30, the reverse of
yesterday. The ORCL day and then the TLAB day.Â
Look for volatility band
trades, especially in the same semis and biotechs from yesterday’s list (
(
KLAC |
Quote |
Chart |
News |
PowerRating),
(
AMAT |
Quote |
Chart |
News |
PowerRating),
(
NVDA |
Quote |
Chart |
News |
PowerRating),
(
AMD |
Quote |
Chart |
News |
PowerRating),
(
IDPH |
Quote |
Chart |
News |
PowerRating),
(
HGSI |
Quote |
Chart |
News |
PowerRating),
(
PDLI |
Quote |
Chart |
News |
PowerRating),
(
ABGX |
Quote |
Chart |
News |
PowerRating),
(
CELG |
Quote |
Chart |
News |
PowerRating) and
(
AMGN |
Quote |
Chart |
News |
PowerRating)) in addition to the QQQs, SPYs and DIAs. After that
point, you can only take what the intraday charts give you, so keep scrolling.
On the short side, assume a
gap down opening so you only get second entries or continuation pattern shorts.
A few stocks to focus on with air beneath are:
(
QLGC |
Quote |
Chart |
News |
PowerRating),
(
QCOM |
Quote |
Chart |
News |
PowerRating),
(
LLTC |
Quote |
Chart |
News |
PowerRating),
(
VRTS |
Quote |
Chart |
News |
PowerRating),
(
XLNX |
Quote |
Chart |
News |
PowerRating) and
(
VRSN |
Quote |
Chart |
News |
PowerRating). Daily chart setups (and they’re kind
of off the beaten track but hey,
(
WM |
Quote |
Chart |
News |
PowerRating) gave us three days in a row, why can’t
the Generals come back for these?) — you have
(
GDW |
Quote |
Chart |
News |
PowerRating),
(
HCA |
Quote |
Chart |
News |
PowerRating),
(
HCR |
Quote |
Chart |
News |
PowerRating),
(
THC |
Quote |
Chart |
News |
PowerRating) (above Monday’s high),
(
WPI |
Quote |
Chart |
News |
PowerRating),
(
NEM |
Quote |
Chart |
News |
PowerRating),
(
MIL |
Quote |
Chart |
News |
PowerRating),
(
GD |
Quote |
Chart |
News |
PowerRating),
(
WAG |
Quote |
Chart |
News |
PowerRating)
and
(
FISV |
Quote |
Chart |
News |
PowerRating).
Have a good trading day.

Tuesday’s S&P 500 five-minute chart
with 8-, 20-,
60- and 260-period
EMAs

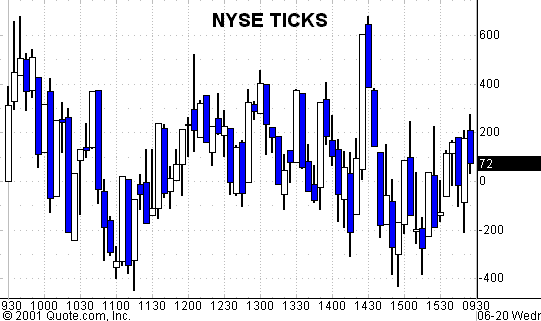
Tuesday’s NYSE
TICK five-minute chart
