Organization, Organization, Organization
The
S&P 500
(
SPX |
Quote |
Chart |
News |
PowerRating)
came out of the gate strong
and went sideways in a tight trading range from 10:45 a.m. until a downside
breakout at 1:45 p.m. The range was 1269.30 which was the intraday high, to
1264.94. From the downside break, it made a knife move down to 1244 by 3:05 p.m.
and closed at 1249.47, almost flat on the day at -0.3%.
The Nasdaq 100
(
NDX |
Quote |
Chart |
News |
PowerRating)
finished green at +2.5% with the Biotechs +4.3% and the SOX +3.1%. Both the
Banks and the Brokers finished about -2% each. The SPX is at a key resistance
area and a level where we will probably catch some air pockets. I have included
a daily chart of the SPYs (see Chart 1 below), which highlights the
resistance.Â
The Fib retracement levels
framed between the 138.70 1/31/01 swingpoint high and the recent 108.04 low are:
the .618 at 127 which stopped it cold yesterday; then the 200-day EMA at 131.33
and the .786 retracement level at 132.14. You also have the longer-term down
trendline from the 9/1/00 high of 153.59, which intersects right at the .786
level and 200-day EMA. This is clearly a Red Alert zone to pay attention to.
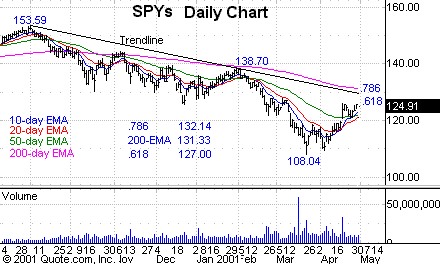
Chart 1. Daily
chart of SPYs with 10-, 20-,
50- and
200-day
EMAs.
To continue the lesson from
yesterday
I have included the daily and five-minute charts of
(
NVLS |
Quote |
Chart |
News |
PowerRating) to highlight
pullback setups following thrust moves. NVLS had made a seven-bar pullback
through Friday (see Chart 2 below), where it closed in a narrow-range Inside Day
setup which was also above all of its daily EMAs.
(
KLAC |
Quote |
Chart |
News |
PowerRating) had also set up in
the same pattern.
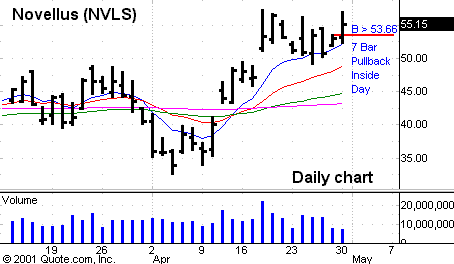
Chart 2. Daily
chart of
(
NVLS |
Quote |
Chart |
News |
PowerRating) with 10-, 20-,
50- and
200-day
EMAs.
On the five-minute chart
(see Chart 3 below), you see where NVLS gave you an Opening Reversal above
53.20, then traded through the Friday high at 53.66 on its way to a 57 intraday
high. KLAC made essentially the same move. It can’t get more defined than that,
and as one of you who emailed me said, “Thanks for the no-brainer.” No
talent involved in that trade. Just organization, and making sure it was in your
trading plan for yesterday.
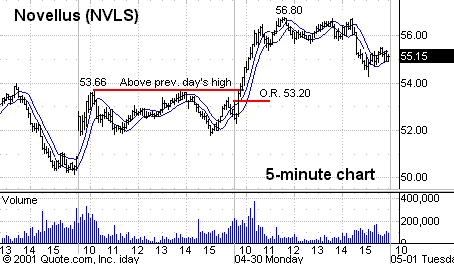
Chart 3. Five-minute chart of
(
NVLS |
Quote |
Chart |
News |
PowerRating) with 8-period (high and low) moving averages.Â
First, you identified a
daily chart pattern for a strong stock in a strong group. Second, you planned
your trade-through entry above the Friday high at 53.66. Third, you did real
good if you took the Opening Reversal above 53.20 because the Semis and the
market were running and the Opening Reversal was the lowest common denominator
of a valid entry.
Also, I hope most of you
caught the
(
BRCM |
Quote |
Chart |
News |
PowerRating) explosion out of its base. It traded above its previous
day’s high of 38.75, above its 50-day EMA of 39, then above 40, which is the top
of the six-week base. It ran to 44.34. You had a heads up in Friday’s
text regarding the possible base breakout and then again in yesterday’s
text. BRCM should have definitely been in your trading plan. Organization,
organization, organization.
Stocks
Today
|
(June
|
||
|
Fair Value
|
Buy
|
Sell
|
|
4.95
|
 6.20 |
 3.65Â
|
Month end is over, and we
are at a resistance level for the SPX with a spread of 4% — 127 to 132.14. The
index has rallied 188 points or 17.4% off the 3/22/01 low in just 27 trading
days.Â
You should take any
intraday shorts that present themselves, especially in the
(
JNPR |
Quote |
Chart |
News |
PowerRating)s and
(
CIEN |
Quote |
Chart |
News |
PowerRating)s,
etc., along with your normal trading plan longs. We can’t know exactly when they
will correct, but we do know that we are in a Red Alert zone and air pocket
shorts are a high probability in the travel-range Game stocks.
You should always start
with the closing range on the five-minute charts and then you get to the
previous day’s low. If the dynamics point red, you take the short if you get
trade-through entry. Not magic.Â
There could be some
accelerated two-way volatility in the near-term, so focus on the stocks with the
big 10-day average daily ranges for intraday long and short setups. These are
not necessarily daily chart setups.
The Travel Range stocks:
JNPR, CIEN,
(
MERQ |
Quote |
Chart |
News |
PowerRating),
(
BRCM |
Quote |
Chart |
News |
PowerRating),
(
CHKP |
Quote |
Chart |
News |
PowerRating),
(
CMVT |
Quote |
Chart |
News |
PowerRating),
(
QCOM |
Quote |
Chart |
News |
PowerRating),
(
QLGC |
Quote |
Chart |
News |
PowerRating),
and
(
VRTS |
Quote |
Chart |
News |
PowerRating).
In the Semis,
(
NVLS |
Quote |
Chart |
News |
PowerRating),
(
KLAC |
Quote |
Chart |
News |
PowerRating) and
(
NVDA |
Quote |
Chart |
News |
PowerRating). You can also add
(
MU |
Quote |
Chart |
News |
PowerRating) even though it doesn’t
have a wide 10-day average daily range — it’s got great travel range.
In the Biotechs:
(
HGSI |
Quote |
Chart |
News |
PowerRating),
(
GENZ |
Quote |
Chart |
News |
PowerRating) and
(
PDLI |
Quote |
Chart |
News |
PowerRating).
Have a good trading day.
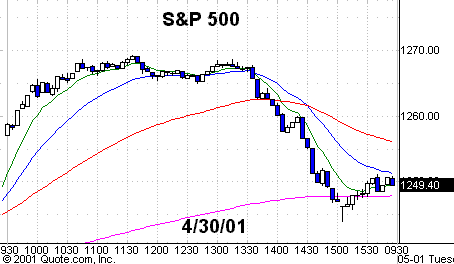
Chart 4. Five-minute chart of
yesterday’s S&P 500
(
SPX |
Quote |
Chart |
News |
PowerRating) with 8-,
20-, 60-
and 260-period EMAs.
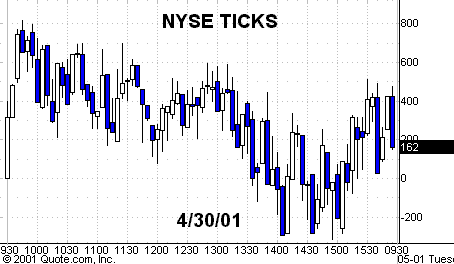
Chart 5. Five-minute
chart of yesterday’s New York Stock Exchange ticks.
