Over the next 2 days, here’s the trading pattern I’m expecting to see
Mutual funds will be mailing out some
very good looking statements this month… they sure saw to that fact on
Wednesday. What started as a little bit bumpy soon turned into a sustained ramp
into the closing bells. With the start of September tomorrow and unofficial end
of summer this weekend, what may we expect from here?
ES (+$50 per index point)
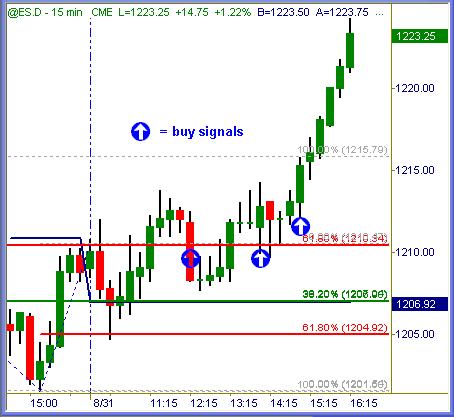
S&P 500 recap: the ES opened and traded inside
its bull = bear zone until roughly 11:00am EST. A breakout and subsequent pull
back offered two buy signals near 1210 and one near 1212 before the northbound
train left its station for good.
There were a couple more swing-trade method
signals on a smaller timeframe basis, but overall this was the action today.
Very methodical, if not somewhat surprising to the heights ES reached. Never
mind layers of recent resistance… several of them were run over by mutual
funds painting the tape in a thin volume atmosphere.
ES did stop just 50% retrace of August high to
low swing and clustered DMA values, setting up more congestion in stop levels
for the remainder of this week.
ER (+$100 per index point)
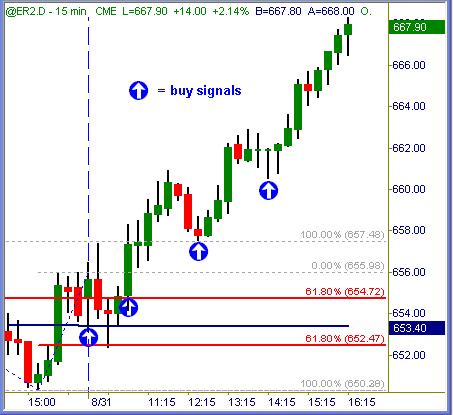
Russell 2000 recap: similar pattern as ES
above… bullish at first, never went bearish confirmed, bullish again near
654.80 and pulled back at least two more times at higher levels. This is the
type of trend-day session where price action stair-steps higher… very bullish
by nature. It plowed thru all manner of recent resistance levels from 660ish
upward, stopping nearly to the tick at 50% retrace of August high to low swing
as well.
ES (+$50 per index point)
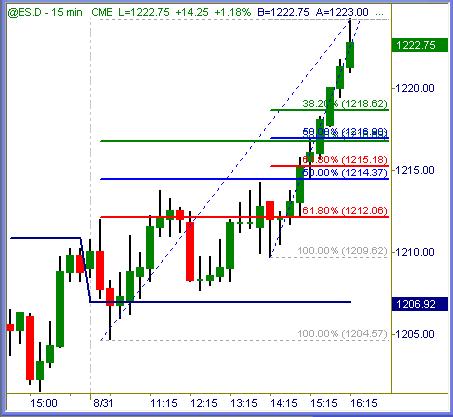
S&P 500 has 1217 level as dual congestion of
retracement values. That should offer initial support, followed by 1215 as next
line in the sand. There is no real bearish zone of bias following a straight-up
move like this, except watching overhead congestion on longer-term charts for
potential failure.
As noted earlier, ES is right at key congestion
of layered resistance on daily charts. The last two sessions this week might see
a struggle to resolve itself higher or lower as we head into the long holiday
weekend.
ER (+$100 per index point)
Russell 2000 has layered support thru the 664+
zone, then again near 663 ~ 663.50 zone. Any pull back to these levels are
likely to hold… and a straight drop thru them is probable to continue.
Just like the ES charted above, ER is meshed in
layered resistance right now. Upside continuation may be tough, we’ll see.
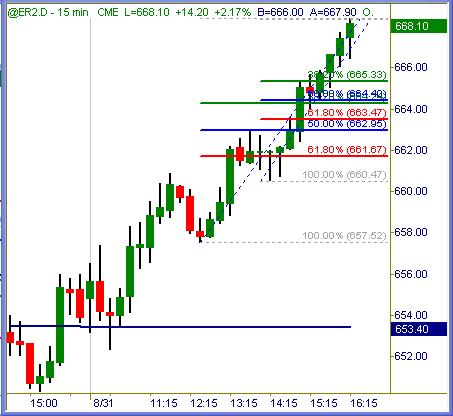
{Price levels posted in charts above are
compiled from a number of different measurements. Over the course of time we
will see these varying levels magnetize = repel price action consistently}
Summation
The end-month markup came as expected & predicted, and they got the
party started early today. What is usually a final-hours’ move began around
11:00am EST and ground higher all day. Absolute lack of sellers painted hockey
stick charts right into the close of futures trading.
That said, how much of this may be unwound
tomorrow or the next day? Trading volume is certain to thin mightily as this
week draws to a close. Sessions following trend days like this tend to chop and
flop sideways more often than not.
Preconceived Mistake
I myself will not be trading again until next Tuesday, for better or
worse. This week was very good to me, but had I been a bit more aggressive on
taking all entry signals it would have been phenomenal instead. The past couple
of years, end-August months’ trading have chewed me to little pieces. Last year
a good friend of mine (+$100 profit scalper in mini markets) and excellent
trader vowed we’d take the last two weeks of this August off.
I remembered that conversation and those prior
experiences this year. I brought that fear of the past into the present, and
trading tippy-toe thru a wonderful period of market action cost me significant
missed profits.
Bottom line? Never try to predict future price
action. Markets are designed to surprise us the most when we least expect it!
My next emini post will be Tuesday morning, and
the weekend article will cover something of educational value to all. Trade
carefully thru the balance of this week, and have an excellent holiday weekend.
Viva La Summer!
Trade To Win
Austin P
(free pivot point calculator, much more inside)
Austin Passamonte is a full-time
professional trader who specializes in E-mini stock index futures, equity
options and commodity markets.
Mr. Passamonte’s trading approach uses proprietary chart patterns found on an
intraday basis. Austin trades privately in the Finger Lakes region of New York.