Pattern Rich Environment
These markets
are full of symmetrical patterns whether it be on the time or price axys they
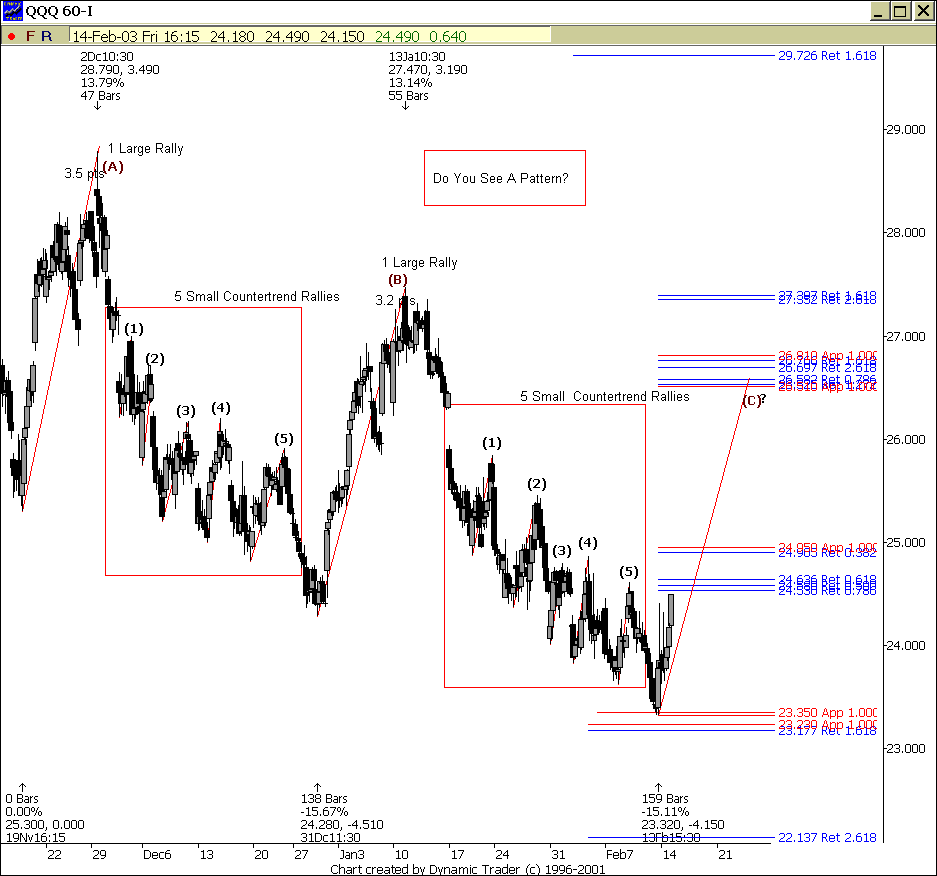
exist every day. When analyzing the 60 minute chart of the Nasdaq 100 tracking
stock this weekend I noticed some very interesting price symmetry. Check it
out:
1) One large
rally is followed by a decline with 5 small rallies before a large rally again
occurs.
2) We have just completed
5 small rallies in this downtrend and hit support, and are on the move to the
upside.
3) If we clear 25.00 this ETF could see a fast move to the 26.50-27.50 range.
Coincidentally
a gap fills up in this Fibonacci price resistance zone as well. So, mark these
levels on your trading plan and take note of symmetry because it presents so
many trading opportunities.

Â
Â
Â
