Pay Attention When We Hit These Levels
The
bet on volatility regardless of direction has paid off handsomely,
as the SPX
(
$SPX.X |
Quote |
Chart |
News |
PowerRating) has declined
63 points since the initiation of the position, and then this Iraq emotion has
carried 77 points to the upside so far. That is a total of 140 points, or about
18% in just 12 days. Imagine that, and all without being cerebral. Certainly the
covered combo on the
(
QQQ |
Quote |
Chart |
News |
PowerRating)s put on at lower levels with a -15% discount,
worst case breakeven scenario, is doing just fine.
This four-day upside Iraq
burst has taken out the 850ish resistance, which is now minor support. Also,
today’s 1.0 volatility band is 853, so we have a point of reference on a
daytrading basis. The major resistance is the 870 head-and-shoulder neckline.
Just below that is the 861 .50 retracement from 769 to 954. 863 is the .618
retracement to the 1994 low from the 1553 all-time high. So far, the SPX has a
776 bottom, 769 bottom, and the current 789 bottom if it holds.
If it does, it sets up
the major inverse head-and-shoulders pattern again, where the neckline is at
about 920 – 925 now. A breakout above this pretty much forces everyone off the
sidelines. The 200-day EMA is just below at 913, while the 12-month EMA is about
the same as the 920 -925 neckline. This would be a classic breakout and widely
broadcast by all of those in the middle of the bell curve and the mutual fund
market timers. To me it just means that the breakout move could run to 1068, or
+15%, which is the .38 retracement to the 1553 high. The head-and-shoulder
breakout measurement is about 1100.
Any move taking out the
870 major resistance into the above-mentioned zone will enable me to put on
another excellent risk/reward position for a move with volatility regardless of
direction because it would be at the very high end of resistance and probably at
an extended standard deviation band. That, of course, means there would be ample
downside air pocket room, in addition to the potential for a good move from the
head-and-shoulder pattern.
Yesterday was sideways
for the major indices, with the closing range 867 – 858, as it bumps up against
the 870 resistance for the first time since the breakdown since Jan. 24. NYSE
volume was 1.5 billion yesterday, a volume ratio of 67 and now has a four-day
moving average of 74, and breadth +270.
The semis continued an
excellent move, with the
(
SMH |
Quote |
Chart |
News |
PowerRating)s advancing +3.7% yesterday vs. the +0.4% for
the SPX. This move off the 20.36 low on Feb. 10 vs. the 20.25 .786 retracement
level to the October low is now +26% and also +17% from the 1,2,3 higher bottom
in the past five days. Yesterday’s 25.67 intraday high was the .50 retracement
to the 31 high, with the .618 retracement at just below the 27 level. Let the
buyer beware.
On the top of this
premature victory emotion, there’s a Triple Witch this Friday, so daytraders
must remain very nimble, to say the least. I think emotion has certainly gotten
well ahead of reality, and the reality will be some severe terrorist attacks on
United States soil, which I, for one, think is a very high probability. Net net,
I have no interest in buying a naked longer-term position into this current
five-day move. I will keep the longer-term positions on and daytrade only
Have a good trading day.

Five-minute chart of
Tuesday’s SPX with 8-, 20-,
60- and 260-period
EMAs
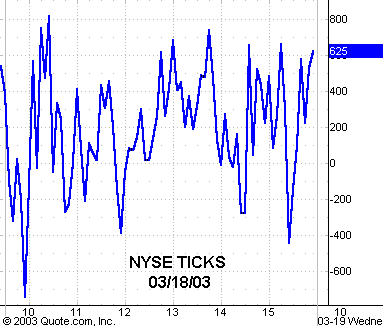
Five-minute chart of
Tuesday’s NYSE TICKS