Periodic Table: Atomic ##79
The atomic mass is 196.96655
amu. The melting point is 1064.43 degrees Celsius. The boiling point is 2807.0
degrees Celsius. There are 79 protons/electrons, and 118 neutrons. Yes, I’m
talking about that yellow metal that’s obtained from the Earth’s crust.
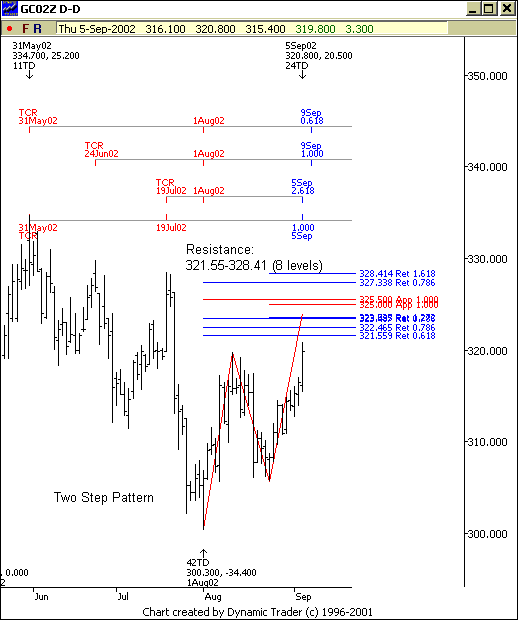
Below is a chart of the
December Contract of Gold (GCZ2), so
follow me on this:
1) The immediate trend
since the end of May is down2) This contract is hitting a large Fibonacci price resistance zone from 321.50-328.50.
This price cluster has eight Fibonacci levels.3) A “Gartley Pattern” (two-step) is forming into this zone.
4) I also have four time cycles pointing to a cycle high between September 5
& 9 (+/- 1 day).
So, what do I do with this
information? If you don’t trade futures, there are select stocks that you could
use as a proxy. The stocks that do not hedge their gold production are the companies
that track the movement of gold best. Stocks like Newmont Mining
(
NEM |
Quote |
Chart |
News |
PowerRating),
Harmony Gold
(
HGMCY |
Quote |
Chart |
News |
PowerRating), Gold Fields
(
GFI |
Quote |
Chart |
News |
PowerRating), Meridian Gold
(
MDG |
Quote |
Chart |
News |
PowerRating)
and Goldcorp
(
GG |
Quote |
Chart |
News |
PowerRating).
With pattern, price resistance,
and time cycles all pointing to a potential reversal to the downside for this
metal, I’m considering short opportunities in these gold stocks. However, if
this gold contract runs up through our price resistance zone (past 328.50),
then this market is telling us the bulls are in control and we are likely to
test the May 31 high.
Now that you’re equipped
with the focus price resistance zone, it’s simply a matter of mapping out YOUR
specific trading plan for tomorrow.
Oh, did I tell you my father-in-law
is a physics and science professor for a private college. Guess who just got
some brownie points…yeah, that’s right!
Good night!