PowerRatings and the Great RIMM Reversal
Stocks continue to move lower in the wake of the last big “sell the news” moment leading up to the bank restructuring plan announced by Treasury Secretary Tim Geithner earlier in the week.
One of the more dramatic “moves lower” was in Research in Motion
(
RIMM |
Quote |
Chart |
News |
PowerRating) which plunged by more than 14% on a close-to-close basis on Wednesday. The stock gapped down at the open after the company announced that its profits were likely to be at the lower end of the forecast range.
While many traders took – and may continue to take – this as terrible news for RIMM, it is worth noting that the stock is still up more than 30% from its early December closing low – even after Wednesday’s correction. What is interesting is that our Short Term PowerRatings could have helped traders avoid RIMM’s mid-week downturn. Moreoever, those same Short Term PowerRatings can help let us know whether or not it makes sense to continue betting against RIMM.

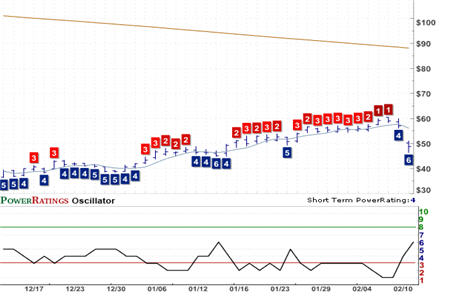
Above is the PowerRating chart for RIMM. Note the low Short Term PowerRatings in red in recent days. Our PowerRating charts graphically display upgrades and downgrades to Short Term PowerRatings, making it easy for short term traders to spot when the stock is overbought and best avoided (Short Term PowerRatings of 3 or lower) and when the stock is oversold and worth considering for a trade to the upside (Short Term PowerRatings of 8 or higher).
Note that our Short Term PowerRatings are backed up by more than a decade of quantified backtesting involving millions of simulated, short term stock trades. PowerRatings for stocks and ETFs are among the cornerstones of our approach to high probability short term trading.
As you can see in the PowerRatings chart, RIMM’s Short Term PowerRatings had been downgraded to the “consider avoiding” range of three or less. Particularly in a stock trading below the 200-day moving average, Short Term PowerRatings of three or less alert us to overbought markets that are best left alone – or sold short – for the time being.

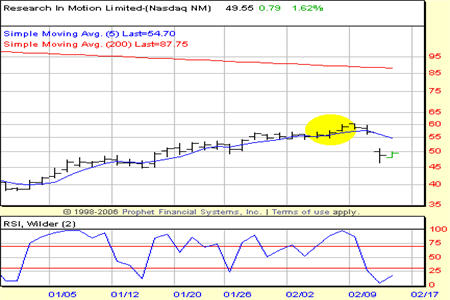
Another clue for traders to stay wary of – or sell short – RIMM came in the form of the stock’s 2-period RSI, which had climbed into extreme overbought territory on February 4th and remained there for additional three days. As we have pointed out consistently, stocks trading below the 200-day moving average that overbought 2-period RSIs are not stocks that traders want to be buying. The odds – and the statistical record – simply point to underperformance in the short term.
So is now the time to sell RIMM short? The PowerRatings chart below is the most recent one for RIMM, and shows the stock to have a Short Term PowerRating of 6. This is a neutral rating, which means that the odds of the stock advancing are roughly equal to the likelihood of the stock continuing to retreat. As high probability short term traders, we aren’t interested in coin-flip trades. So regardless of the hit RIMM took on Wednesday, the stock’s Short Term PowerRating suggests leaving the stock alone for now.

Does your stock trading need a tune-up? Our highest Short Term PowerRatings stocks have outperformed the average stock by a margin of nearly 17 to 1 after five days.
| Click here to start your free, 7-day trial to our Short Term PowerRatings! |
Whether you have a trading strategy of your own that could use a boost or are looking for a way to tell the stocks that will move higher in the short term from the stocks that are more likely to disappoint, our Short Term PowerRatings are based on more than a decade of quantified, backtested simulated stock trades involving millions of stocks between 1995 and 2007. Click the link above or call us at 888-484-8220, extension 1, and start your free trial today.
David Penn is Editor in Chief at TradingMarkets.com.
