PowerRatings Chartology: A Leveraged Look at the Markets
Stocks are up moderately in the first hour of trading, as the oversold conditions created by two days of selling attract a growing number of traders.
This week on PowerRatings Chartology we’re going to take a look at the broad market indexes through the lens of leveraged exchange-traded funds that track these indexes.
Why look at the leveraged ETFs? As Barry Ritholtz,professional trader and author of the Big Picture blog, pointed out in a recent Big Saturday Interview, traders who are looking to speculate at market turns can use leveraged ETFs to gain exposure to a potential move without risking as much capital as they might otherwise.
Click here to access our Big Saturday Interview with Barry Ritholtz!
All three of the ETFs in today’s report have Short Term PowerRatings of 4. This puts them closer to the “avoid buying†side of the PowerRatings spectrum. But what I want to focus on is the way that the PowerRatings charts and index ETFs can be used to help anticipate the likelihood of stocks bouncing or pulling back.
ProShares Ultra Dow 30 ETF
(
DDM |
Quote |
Chart |
News |
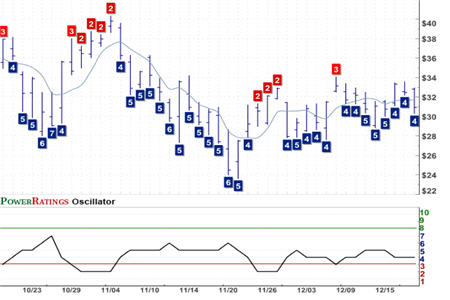
PowerRating) Short Term PowerRating 4. RSI(2): 24.92

Consider first the ProShares Ultra Dow 30 ETF. Note in the chart above how rallies in DDM have been accompanied by exceptionally low Short Term PowerRatings in late October, late November and early December. The appearance of these ratings was a warning to traders who were making leveraged bets off the lows that the time for profit-taking had arrived.
ProShares Ultra QQQ ETF
(
QLD |
Quote |
Chart |
News |
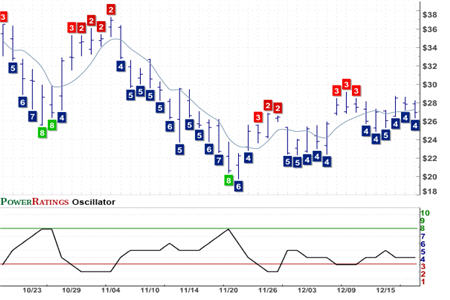
PowerRating) Short Term PowerRating 4. RSI(2): 32.90

The PowerRatings chart of the ProShares Ultra QQQ ETF not only shows how low Short Term PowerRatings can serve as warnings to begin taking profits on bottom-picking trades. But also how high Short Term PowerRatings can signal opportunities. Notice how in late October and late November major short term moves higher were anticipated by Short Term PowerRatings that had been upgraded to 8.
ProShares Ultra S&P 500 ETF
(
SSO |
Quote |
Chart |
News |
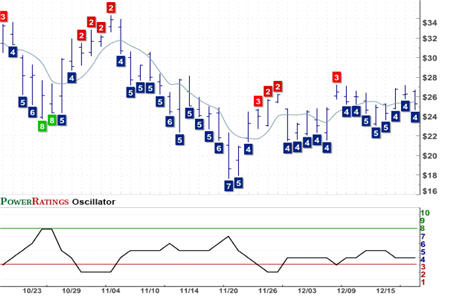
PowerRating) Short Term PowerRating 4. RSI(2): 32.27

Lastly, let’s take a look at the ProShares Ultra S&P 500 ETF. Here we see a PowerRatings chart that is similar to both of the previous charts — mostly lacking the Short Term PowerRating upgrades during the November pullback. Again, what is key is the way that the ETF moves back and forth between oversold conditions (typically characterized by high Short Term PowerRatings) and overbought conditions (typically marked by low Short Term PowerRatings).
PowerRatings charts are a great tool for short term traders — not only in helping traders spot opportunities to buy, but also as a way of figuring out when to take profits in existing trades, when to sell short, and when markets are providing few edges (neither high nor low Short Term PowerRatings) at all.
According to a recent report, eight out of ten securities traded are exchange-traded funds. Want to learn how to trade them? Click here to find out what traders are saying about Larry Connors’ new book, Short Term Trading Strategies That Work: A Quantified Guide to Trading Stocks and ETFs!
David Penn is Editor in Chief at TradingMarkets.com.
