PowerRatings Chartology: Swing Trading and the 200-day Moving Average
Stocks are in full speed retreat on Friday, hours after the Chicago Mercantile Exchange was forced to halt trading when index futures locked limit down in the premarket.
Last night, I did something that all swing traders should do before looking for potential stocks to buy: I filtered out every single stock that was trading below its 200-day moving average.
We’re going to spend a lot of time today and this weekend talking about this fundamental rule. This rule was the first thing we mentioned over a week ago when we published our TradingMarkets 10 Trading Rules as part of our promotion for Larry Connor’s Swing Trading College: Avoid Stocks Trading Below the 200-day Moving Average.
There are plenty of things that swing traders can do right and wrong in the markets. And, in our research going back to 1995, buying stocks that are trading below the 200-day moving average is near the top of that list.
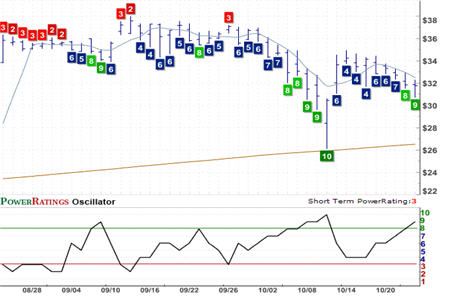
Alpharma Inc.
(
ALO |
Quote |
Chart |
News |
PowerRating) Short Term PowerRating 9. RSI(2): 11.76

Stocks that trade above the 200-day moving average more likely to respond positively after a pullback than are stocks that trade below their 200-day moving averages. Not only that, but these relatively stronger stocks are often the ones that investors will pile into when the broader markets recover and begin to move higher. In other words, many of the stocks that make it through the tough times, actually thrive when times start to get even marginally better.
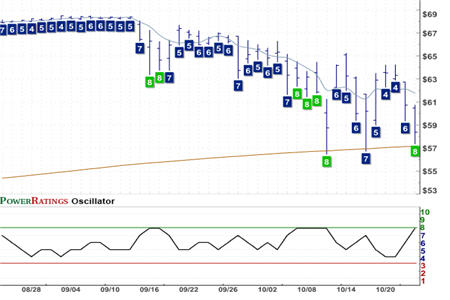
Anheuser-Busch Companies Inc.
(
BUD |
Quote |
Chart |
News |
PowerRating) Short Term PowerRating 8. RSI(2): 6.81

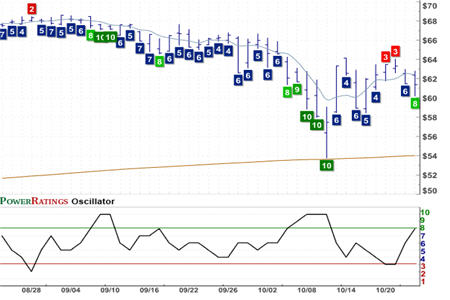
Three stocks trading above their 200-day moving averages caught my eye last night. Two have Short Term PowerRatings of 8 and one has a Short Term PowerRating of 9. More importantly, all three of these stocks are still above their 200-day moving averages Friday morning, with sellers driving the major market indexes down by as much as 4% in the first few hours of trading.
Barr Pharmaceuticals
(
BRL |
Quote |
Chart |
News |
PowerRating) Short Term PowerRating 8. RSI(2): 20.17

Note that, as of this writing, ALO has a 2-period RSI of 2.29 and has pulled back by 5%. BUD has a 2-period RSI of 6.46 and has recovered from early losses to trade essentially unchanged from Thursday’s close. And BRL, which has pulled back by an additional 2% Friday morning, now has a 2-period RSI of less than 7.
Does your stock trading need a tune-up? Our highest Short Term PowerRatings stocks have outperformed the average stock by a margin of nearly 17 to 1 after five days.
| Click here to start your free, 7-day trial to our Short Term PowerRatings! |
Whether you have a trading strategy of your own that could use a boost or are looking for a way to tell the stocks that will move higher in the short term from the stocks that are more likely to disappoint, our Short Term PowerRatings are based on more than a decade of quantified, backtested simulated stock trades involving millions of stocks between 1995 and 2007. Click the link above or call us at 888-484-8220, extension 1, and start your free trial today.
David Penn is Editor in Chief at TradingMarkets.com.
