Pressure Points
After a
negative start with the S&P 500
(
SPX |
Quote |
Chart |
News |
PowerRating) declining
from 1259 to 1248, and the Nasdaq 100
(
NDX |
Quote |
Chart |
News |
PowerRating) from 1836 to 1785, both indexes
rallied to the 3:00 p.m. bar, before fading a bit into the close. The NDX ran
1.27 times the early leg down to an 1852 high, then faded to 1826, closing at
1826.34. The SPX ran 1.618 times its early leg down, hitting a 1265.34 high,
before fading to 1259.Â
Total volume was relatively
light at 1 billion, and a volume ratio of 54. This ratio was negative in the
early stages of the rally, as declining volume was 2.5 to 1 vs. advancing
volume. When the indexes rise against this kind of negative ratio, it is usually
a manipulated move which will often get whacked later in the day. In this case,
the NDX 100 was advancing early — while the SPX and Dow then turned around —
and the volume ratio improved with it to the positive side.Â
The 50-day EMA on the SPX
is 1249.85 and the .38 retracement level is 1227. It is still short-term
oversold and a drop into the zone between the 50-day EMA and the .38 level would
be a good point for a short-term rally. After that, I expect a deeper Fib
retracement to test the 1081 low and if this current rally is, in fact, a Wave 4
move, then new lows are not out of the question on a Wave 5 down. As I said
going into this recent option expiration and resistance zone, take some money
off the table and/or hedge with puts, etc., and I repeat that again into any
significant rally from the 50-day EMA to .38 retracement zone that extends up
past the resistance zone — or right at it.
I would expect a deeper Fib
retracement and/or test of lows to come in the July/August period, which will
probably fuel an explosive rally. That framework is, however, just opinion and
reality is price itself. Nothing changes direction until the SPX trades below
the 50-day EMA and then 1240. For
the NDX, I use 1768 as the first pressure point and then 1743. On the upside, I
use the 50-day EMA at 1875 as the first upside inflection point if it is to get
above the 2074 high and 2087 resistance. In
between these levels is just noise for a longer-term position trader, but will
provide some excellent short-term volatility for the short-term trader.
Stocks
Today
On the buy side:
(
PCAR |
Quote |
Chart |
News |
PowerRating),
(
CTAS |
Quote |
Chart |
News |
PowerRating),
(
CEFT |
Quote |
Chart |
News |
PowerRating),
(
CHIR |
Quote |
Chart |
News |
PowerRating),
(
AMGN |
Quote |
Chart |
News |
PowerRating),
(
PDLI |
Quote |
Chart |
News |
PowerRating),
(
RFMD |
Quote |
Chart |
News |
PowerRating) and
(
NVLS |
Quote |
Chart |
News |
PowerRating).Â
Also in the financials:
(
BK |
Quote |
Chart |
News |
PowerRating),
(
FNM |
Quote |
Chart |
News |
PowerRating),
(
PVN |
Quote |
Chart |
News |
PowerRating),
(
COF |
Quote |
Chart |
News |
PowerRating) and
(
LEH |
Quote |
Chart |
News |
PowerRating).Â
Other stocks:
(
CAH |
Quote |
Chart |
News |
PowerRating),
(
CSC |
Quote |
Chart |
News |
PowerRating),
(
AL |
Quote |
Chart |
News |
PowerRating),
(
DOW |
Quote |
Chart |
News |
PowerRating),
(
WY |
Quote |
Chart |
News |
PowerRating),
(
BCC |
Quote |
Chart |
News |
PowerRating),
(
UTX |
Quote |
Chart |
News |
PowerRating),
(
GD |
Quote |
Chart |
News |
PowerRating),
(
TMPW |
Quote |
Chart |
News |
PowerRating),
(
LLY |
Quote |
Chart |
News |
PowerRating),
(
AHP |
Quote |
Chart |
News |
PowerRating) and
(
SGP |
Quote |
Chart |
News |
PowerRating).
My computers are down this morning thanks to our friend, DSL, so
I can’t access programs but will try to have them up later.
 Have a good trading day.
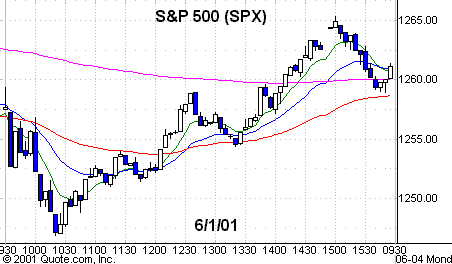
Five-minute chart of Friday’s S&P 500 (SPX) with 8-,
20-, 60-
and 260-EMAs

Five-minute chart of Friday’s NYSE Ticks