Price Break Yet To Confirm Multiple Technical Red Alerts
From 1990 to 1997, Kevin Haggerty served as Senior Vice President for Equity Trading at Fidelity Capital Markets, Boston, a division of Fidelity Investments. He was responsible for all U.S. institutional Listed, OTC and Option trading in addition to all major Exchange Floor Executions. For a free trial to Kevin’s Daily Trading Report, please click here.
Commentary for 3/12/12
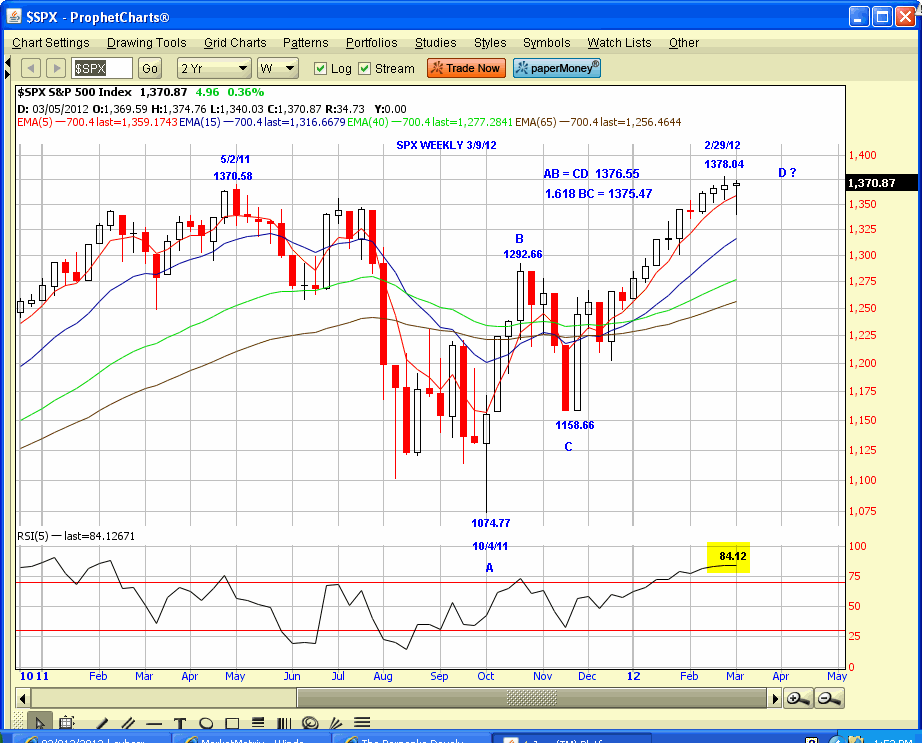
The SPX declined -2.75% from the 2/29 1378.04 intraday high to a 1340.03 low last Tues [3/6], the anniversary of the SPX 667 bear market low. However, that was the extent of the move, and the SPX made a 1374.78 intraday high Fri and closed at 1370.87, or +.09% on the week as it continues to churn around the 5/2/11 1370.58 high.
The IWM had declined -5.9% from 83.31 to 78.41 and the 50DEMA, then reversed for a +4.1% gain the last few trading days.The TRAN, which has failed to confirm the INDU new highs yet, declined -6.7% from the 2/3/12 5384 high to a 5029 low on 3/6/12, which was just above its 4989 200DEMA. It has bounced back +2.6% the last 3 days.
The SPX closed Fri in the 55 TD fib count zone from the 1202.37 12/19/11 low and the 89-90 TD zone from the 1292.66 high on 10/27/11, so there is some symmetry. There is additional fib symmetry in that on the SPX weekly chart, you can see that legs AB = BC at 1376.55, and 1.618 x leg BC = 1375.47 There is no indication of an intermediate trend price breakdown yet as the SPX has closed above its rising 5 WK EMA, which is now 1359.17, for 11 straight weeks. It has been a low volume advance and the leadership has narrowed as fewer major stocks are making new highs.
The intermediate term 5RSI is significantly O/B at 84.12, after advancing 9 of the last 10 weeks, and the long term monthly 5RSI is also now in the O/B zone at 72.68, while the SPX is just 5% below the 2012 bullish buy side pundits targets in the 1425-1475 zone, so it’s a question of when, but not if this Bernanke advance will correct more than the recent -2.7%.
Many aggressive hedge funds are well hedged on their equity positions at these levels to protect or take recent gains into this extended intermediate O/B market that has many red alerts.

Click here to find full details on Kevin’s courses including Trading with the Generals with over 20 hours of professional market strategies. And for a free trial to Kevin’s daily trading service, click here.
