Primary Focus Remains QQQs And SMHs
Volume
continues to shrink after the three-day thrust.
The last two days the SPX
(
$SPX.X |
Quote |
Chart |
News |
PowerRating)
has lost -6 and then -8 points yesterday on an
(
SPY |
Quote |
Chart |
News |
PowerRating) volume of 31 million
shares, and just 29 million yesterday. The first two days of this reflex off
the .786 retracement zone of 808 for the SPX had the SPYs trading 58 million
shares, then 60 million shares. The third up day being the weather-influenced
session resulted in 39 million shares for the SPYs.
NYSE volume yesterday was
again very light at 1.16 billion, a volume ratio of 33, and breadth -299. Both
the SPX and Dow
(
$INDU |
Quote |
Chart |
News |
PowerRating) lost about 1.0%, with the NDX
(
$NDX.X |
Quote |
Chart |
News |
PowerRating)
ending at -0.4%.
After yesterday’s
trading, the
(
QQQ |
Quote |
Chart |
News |
PowerRating)s closed in a three-day dynamite triangle and has held
above the intersection of the gap day, which is between 24.68 and 24.50. The
past two days’ lows have been 24.71 and 24.84. You are certainly prepared to
play this upside continuation pattern if we go green today. During this decline
from the December highs, the QQQs have traded by the numbers. The first rally
was +13.1% from the .50 retracement level which is 24.27. The actual low for the
QQQs was 24.28. This move carried to 27.47 before declining to the .618
retracement level which is 23.21. The actual low was 23.32. So far, this move
has gained +8.7% to the 25.34 high of this current three-day triangle; 25.34
just happens to be the .382 retracement level. Remember, these levels will very
often come into play in both directions.
If the QQQs break to the
upside, they can carry to the downtrend line, which right now is at about 26.30.
And a similar +13% move for this rally low to high puts it at about 26.35. The
.618 retracement to the last swing point high of 27.47 is 25.88. The .707
retracement is 26.25, and the .786 26.58. You should be aware of these levels
because the QQQs are in a parallel line pattern after the .50 and .618
retracements to the October lows. You obviously should be aware of any moving
averages in play on a daily basis. You can’t know whether this move will result
in another low below 23.32 or not. The .707 level is down at 22.41, and the .786
is 21.69.
My primary focus remains
on the QQQs rather than the SPYs, and of course, the
(
SMH |
Quote |
Chart |
News |
PowerRating)s are always the
number one focus because of the higher volatility. I just keep waiting for each
downside overreaction due to another analyst flip-flop, just like the last one
from the .786 level of 20.25. The actual low was 20.36. They have gained +14.1%
low to high in just three days, and I sold one half of the position into the
move. I will maintain the longer-term QQQ combo put on in the .618 retracement
zone, but that was in effect buying the QQQs at a 15% discount. I would rather
see much lower prices going forward than 20.41 in order to put more on.
Have a good trading day,
and make sure you don’t go long over this weekend unless you have an options
strategy, and certainly not in any regular common stocks.

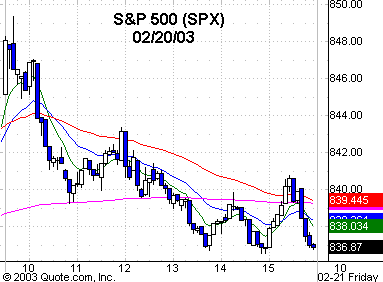
Five-minute chart of
Thursday’s SPX with 8-, 20-,
60- and 260-period
EMAs

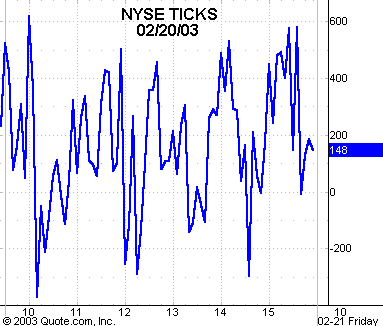
Five-minute chart of
Thursday’s NYSE TICKS
