Program Reversal
All
three major indexes finished slightly
down yesterday — the S&P 500
(
SPX |
Quote |
Chart |
News |
PowerRating) -0.3%, the Nasdaq 100
(
NDX |
Quote |
Chart |
News |
PowerRating) -0.5% and the Dow -0.7%. The SPX had an extremely narrow-range day
of 9 points in spite of volume at about 1.3 billion. The NDX also had a
narrow-range day of 47.5 points.Â
Of course, thanks to our
program friends, the travel range for the SPX was over five times its daily
range of 9 points, while the NDX had 225 points of travel range compared to the
actual daily range (high – low) of 47.5 points. The game goes on. There
were some excellent trades in the
(
QQQ |
Quote |
Chart |
News |
PowerRating)s and SPYs yesterday with that
movement.Â
Also, we got some nice
trade-through entries above the previous highs in most of our financials, in
addition to
(
PDLI |
Quote |
Chart |
News |
PowerRating) which traded above its previous high of 75.72, running
to 80.06 on even a wider-range bar than the previous day and also on increased
volume. You always have to be prepared for continuation moves because the
Generals can always return to extend the move if their pockets aren’t full or
they’re trying to bull a position.
Biotechs like
(
PDLI |
Quote |
Chart |
News |
PowerRating)
which is up 146% in this rally,
(
HGSI |
Quote |
Chart |
News |
PowerRating) +110% and
(
IDPH |
Quote |
Chart |
News |
PowerRating) +92% are now
in an excellent daytraders’ zone. The Generals are involved big time at lower
prices, the Johnny-come-latelys now buying into strength, and because of the big
moves, the Fundamental Anal-ysts will be all over them, pro and con. For
example, IDPH, after four straight top-of-the-range closes, gave you a reversal
day close in the bottom of the range and goes in your trading plan today as a
possible airpocket short.
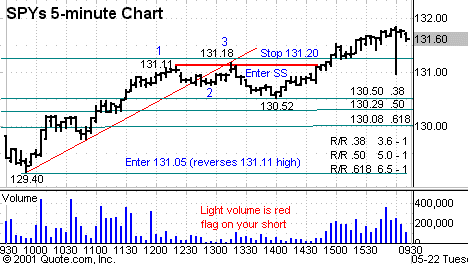
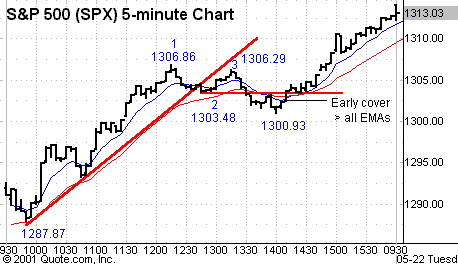
As mentioned in yesterday’s
commentary, I have included the charts of the SPX and SPY from Monday’s
action at the 1305-1307 resistance zone. Look at this in conjunction with the
1,2,3 buy patterns from Monday’s
text which depicted Friday’s trades in both the SPX and NDX. The key points
in the basic 1,2,3 patterns are that a trendline must be broken with at least
two closes below the line, then a retracement attempt at the high, followed by a
break of the 2 point as you see in the SPX chart of
a 1,2,3 lower top.
If the retracement is at
least 50%, you can take entry below the low of the high retracement bar,
provided the close was below the open and below the midpoint. As you can see on
the SPY chart, you got a 1,2,3 higher top (or a Shake and Bake for those of you
who attended my seminar). This was an excellent setup as it diverged from the
SPX.Â
In this pattern, you need
the trendline-break requirement establishing the 2 point,
but when it makes a marginal new high for the 1,2,3 higher top, your short entry
is on a reversal of the prior top which, in this case, is below 131.11. You can
also take the trend entry below swingpoint 2, if
the dynamics confirm. The key to
the 1,2,3 higher top is that the risk/reward is so good (with a stop just above
the 131.18 high) vs. what you can make on a normal Fib retracement. It is simple
trade logic, which is following direction but oh, so rewarding!

Chart
1. 1, 2, 3 HIGHER TOP
Five-minute chart of 5/22/01 SPYs
(SS = Short
Sale and R/R = Risk/Reward)

Chart
2.  1, 2, 3 LOWER TOP
Five-minute chart of S&P 500 (SPX) 5/22/01
with 8- and 20-period
EMAs
We are, as you know,
extended into this rally, but with the holiday weekend next in line. Yesterday
the volume ratio was positive until a large sell program hit the tape on the
3:35 p.m. bar with NYSE Ticks +688 at the time, but by the 3:45 p.m. bar, Ticks
were -200 and there was a negative volume swing of over 100 million on that
program — which is good size. When I see that action late in the day, it puts
me on alert for possible airpocket shorts the next morning.
Stocks
Today
|
(June
|
||
|
Fair Value
|
Buy
|
Sell
|
|
2.65
|
 3.80  |
 1.40 Â
|
There are lean setups on
the daily charts. Potential airpocket shorts with bottom-of-the-range closes on
the daily chart are:
(
CREE |
Quote |
Chart |
News |
PowerRating),
(
IDPH |
Quote |
Chart |
News |
PowerRating),
(
QLGC |
Quote |
Chart |
News |
PowerRating) and
(
CMVT |
Quote |
Chart |
News |
PowerRating) (below
the 50-day EMA). Also
(
NVLS |
Quote |
Chart |
News |
PowerRating) and
(
IRF |
Quote |
Chart |
News |
PowerRating). Yes, stocks that I love — but
there is always a time to sell ’em.
Daily chart setups on the
long side:
(
DISH |
Quote |
Chart |
News |
PowerRating),
(
LLY |
Quote |
Chart |
News |
PowerRating),
(
DD |
Quote |
Chart |
News |
PowerRating),
(
C |
Quote |
Chart |
News |
PowerRating),
(
STI |
Quote |
Chart |
News |
PowerRating),
(
DDX |
Quote |
Chart |
News |
PowerRating),
(
FNM |
Quote |
Chart |
News |
PowerRating),
and
(
QCOM |
Quote |
Chart |
News |
PowerRating) (above Monday’s high). Also, be ready for any continuation moves
in yesterday’s brokers like
(
MWD |
Quote |
Chart |
News |
PowerRating),
(
GS |
Quote |
Chart |
News |
PowerRating), etc.Â
Focus heavily on the QQQs
and SPYs today — there will be activity.
Have a good trading day.

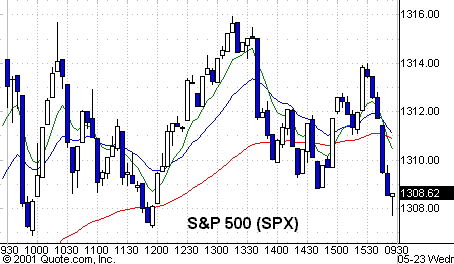
Five-minute charts of yesterday’s S&P 500 (SPX) with 8-,
20-, 60-
and 260-EMAs.

Five-minute charts of yesterday’s NYSE Ticks.
