Pursuing the green in clean energy
Investors can use ETFs
to accomplish a number of trading goals.
My recent blog post illustrated how ETFs can be used to diversify holdings
by spreading capital across non-correlated assets. In this post, we’ll look at
an example of how ETFs allow us to participate in sector themes.
With ETFs, individual investors can make the
transition from thinking of themselves as traders to regarding themselves as
portfolio managers. Increasingly, every well-capitalized investor can become
his or her own hedge fund.
The sector theme that I’d like to pursue is clean
energy. Several forces have come together recently to support the pursuit of
energy alternatives:
1) On the heels of the Iraq experience, U.S.
citizens will look to energy independence as a response to national security
that will supplant the recent paradigm of unilateral interventionism.
2) Clean energy is a natural response to
concerns over global warming that will help us re-establish ties with
ecologically concerned allies abroad.
3) Clean energy is no longer a pipe dream, as
the average consumer is now familiar with ethanol and hybrid engines–not to
mention higher fuel prices.
4) Energy independence is increasingly seen as a
way of taking us out of thorny competitions for resources with Russia, China,
India, and developing nations.
5) Most important of all, clean energy has
become as American as apple pie. Republicans are looking to
launch a large initiative
and Democrats are ready to make
global warming a national priority.
Bottom line? We’re going to see an increasing
share of resources devoted to clean energy, which could bring some green to
investors in that sector.
The problem, however, is that the sector is
highly fragmented. Where do you place your bets: Renewable energy, such as
solar? Power conservation? Clean fuels? Power storage? Fuel cell
technology?
The best play I can find in the field is the
diversified one: the PowerShares WilderHill Clean Energy Fund (symbol PBW).
The fund holds 42 stocks across the green spectrum and allots no more than 4% of
the portfolio to any single stock. (Click
here for details on the construction of the index on which the Fund is
based). Most of the issues are
small cap, pure plays in clean energy.
Participation in the Fund has been growing. When
it was first introduced in March, 2005, the average volume was under 100,000
shares per day. By June, 2006, the 50-day moving average of volume peaked at
over 700,000 shares per day and, at present, is over 300,000. As investors seek
a way to participate in the green theme without having to crystal ball
individual stock winners, the volume should continue to expand.
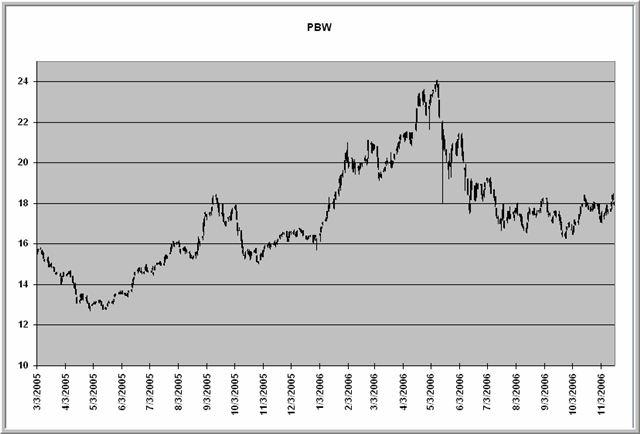
As the chart below indicates, PBW nearly doubled
in value between May, 2005 and May, 2006. Volume exploded by over a factor of
10 during that time. Since then PBW has pulled back from May highs on reduced
volume and failed to participate meaningfully in the recent large-cap/value
stock led rally. Note also that the Fund is quite volatile relative to the S&P
500 Index. In 2006 thus far, the average daily change has been 1.42% and the
average daily high-low range has been 2.25%.

The correlation between PBW and the S&P 500 Index
(
SPY |
Quote |
Chart |
News |
PowerRating) during 2006 has been .62. That means that general market movement
accounts for over 36% of the variance in PBW price. The correlation between PBW
and the Russell 2000 Index
(
IWM |
Quote |
Chart |
News |
PowerRating) in 2006 has been .71, accounting for nearly
half the variance in PBW price change.
What to do? I’m waiting for a general market
pullback and will assess PBW at that time. It may be a while before these
stocks generate meaningful profits, and it will take Congress and the President
a while to hammer out any clean energy initiatives. It is difficult to imagine,
however, that the two parties, struggling for a popular response to problems
with terrorism and global warming, won’t try to outdo each other by wrapping
themselves in the mantle of clean.
And that could mean green for investors with a
longer-term horizon.
Bio:
Brett N. Steenbarger, Ph.D.
is Associate Clinical Professor of Psychiatry and Behavioral Sciences at SUNY
Upstate Medical University in Syracuse, NY and author of
The Psychology of Trading (Wiley, 2003). As
Director of Trader Development for Kingstree Trading, LLC in Chicago, he has
mentored numerous professional traders and coordinated a training program for
traders. An active trader of the stock indexes, Brett utilizes
statistically-based pattern recognition for intraday trading. Brett does not
offer commercial services to traders, but maintains an archive of articles and a
trading blog at
www.brettsteenbarger.com and a blog of market
analytics at
www.traderfeed.blogspot.com. His book,
Enhancing Trader Performance, was recently
released for publication (Wiley).
